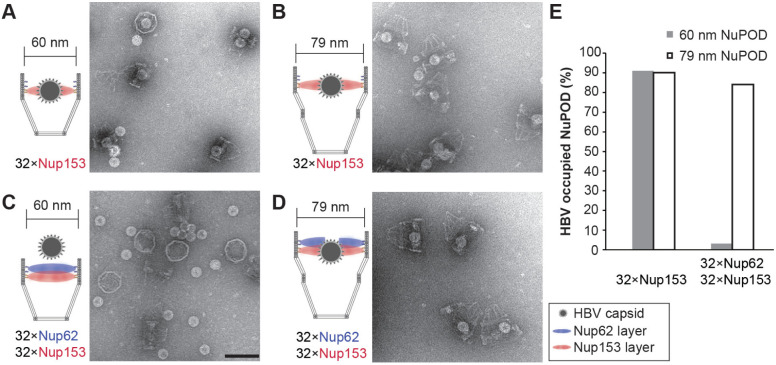
Figure 4: HBV capsid interactions with NuPODs of different widths.
(A) HBV capsids mixed with capped 60-nm Nup153 NuPODs. (B) HBV capsids mixed with capped 79-nm Nup153 NuPODs. (C) HBV capsids mixed with capped 60-nm Nup62-Nup153 NuPODs. (D) HBV capsids mixed with capped 79-nm Nup62-Nup153 NuPODs. For (A)–(D), schematic diagrams of the binding experiments are shown next to representative TEM images. Scale bar: 100 nm. (E) Percentages of NuPODs occupied by HBV capsids in experiments (A)–(D). NuPODs counted in each experiment are (from left to right): 168, 247, 279 and 215.

