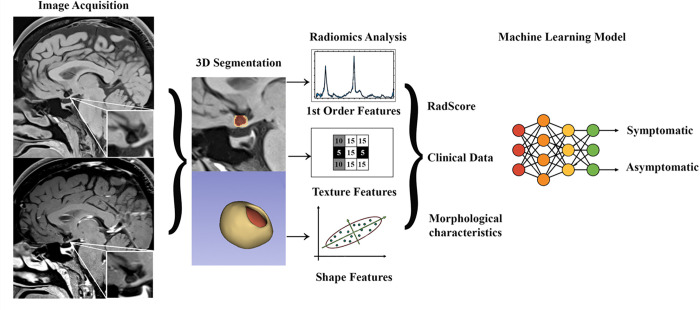
Figure 1. Analysis Pipeline.
Images were acquired with a 3T high resolution magnetic resonance imaging with and without contrast gadolinium. Segmentation of the aneurysm wall (shell) and aneurysm sac were performed in 3D Slicer. Radiomic analysis included extraction of enhancement (1st order features), texture and shape features of the aneurysm wall. Transform-based RFs were not included in the figure, as these were not used for analysis. Significant RFs, clinical data and morphological aneurysm characteristics were used to build a machine learning model that accurately identified symptomatic status.

