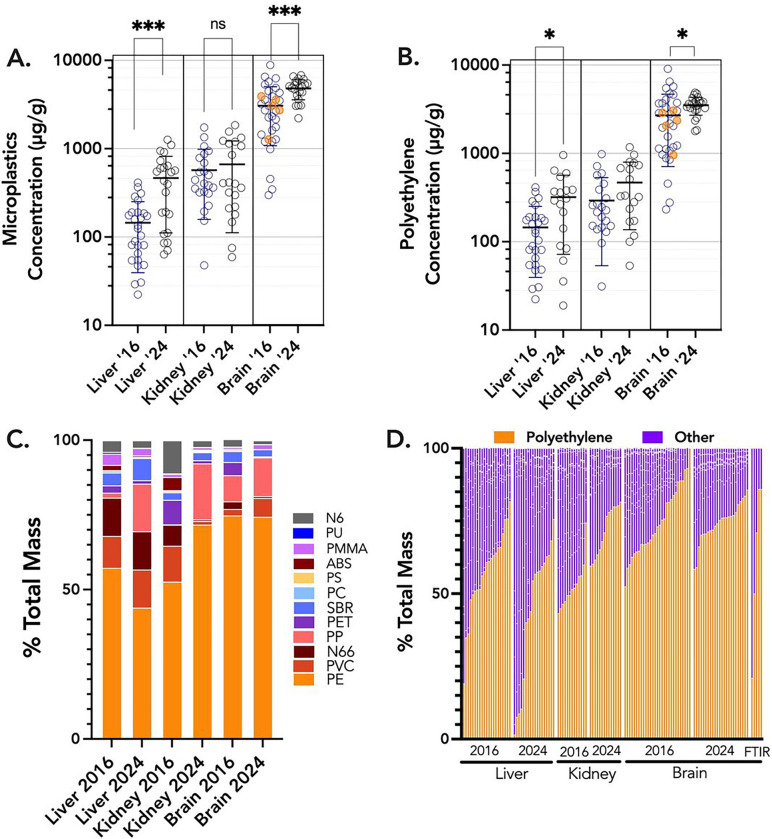
Figure 1.
Overview of total MNP concentrations from all decedent samples from liver, kidney, and brain. A. All data shown, with the bar representing arithmetic mean value and the standard deviation. Orange colored symbols in the 2016 brain samples were analyzed independently at Oklahoma State University. Asterisks indicate significant differences temporal changes (from 2016 to 2024) using a nonparametric t-test (Mann Whitney). Brain concentrations were also significantly higher than liver and kidney, by ANOVA. B. Using only polyethylene data, similar trends were noted, although the kidney concentrations did not increase in the 2024 samples. C. Overall distribution of 12 different polymers suggests a greater accumulation of polyethylene in the brain relative to liver or kidney. Polyethylene (PE), Polyvinyl chloride (PVC), Nylon 66 (N66), Styrene-butadiene (SBR), Acrylonitrile Butadiene Styrene (ABS), Polyethylene terephthalate (PET), Nylon 6 (N6), Poly(methyl methacrylate) (PMMA), Polyurethane (PU), Polycarbonate (PC), Polypropylene (PP), Polystyrene (PS). D. Distribution trends for PE across each organ and collection date, including 5 additional samples (on the right) from the 2016 brain collections that were analysed by Attenuated Total Reflectance-Fourier-transform infrared spectroscopy (FTIR).

