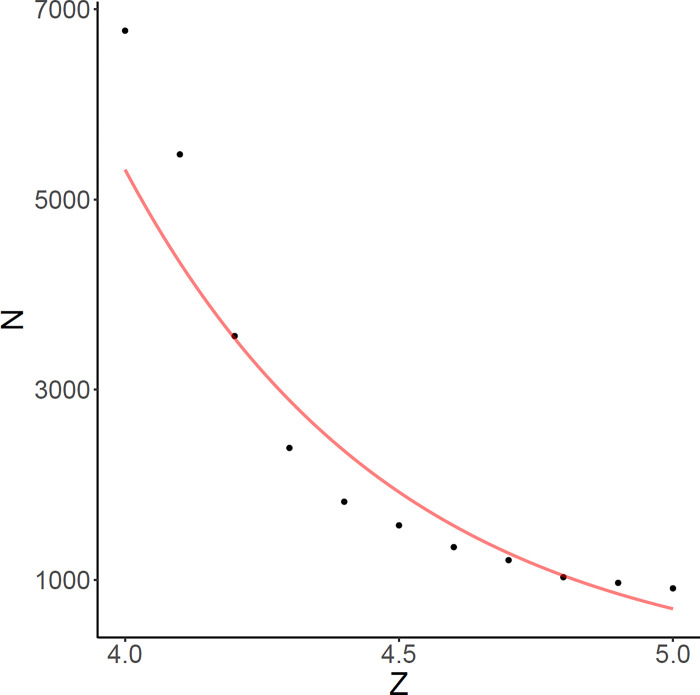
Figure 3. Required sample size for carrier statistic to attain 80% sensitivity based on simulations.
Y-axis denotes total sample size with 50% case-control ratio and x-axis denotes effect size of causal variant on gene expression. Log-transformed sample size is regressed on Z and the fitted curve is shown in red.

