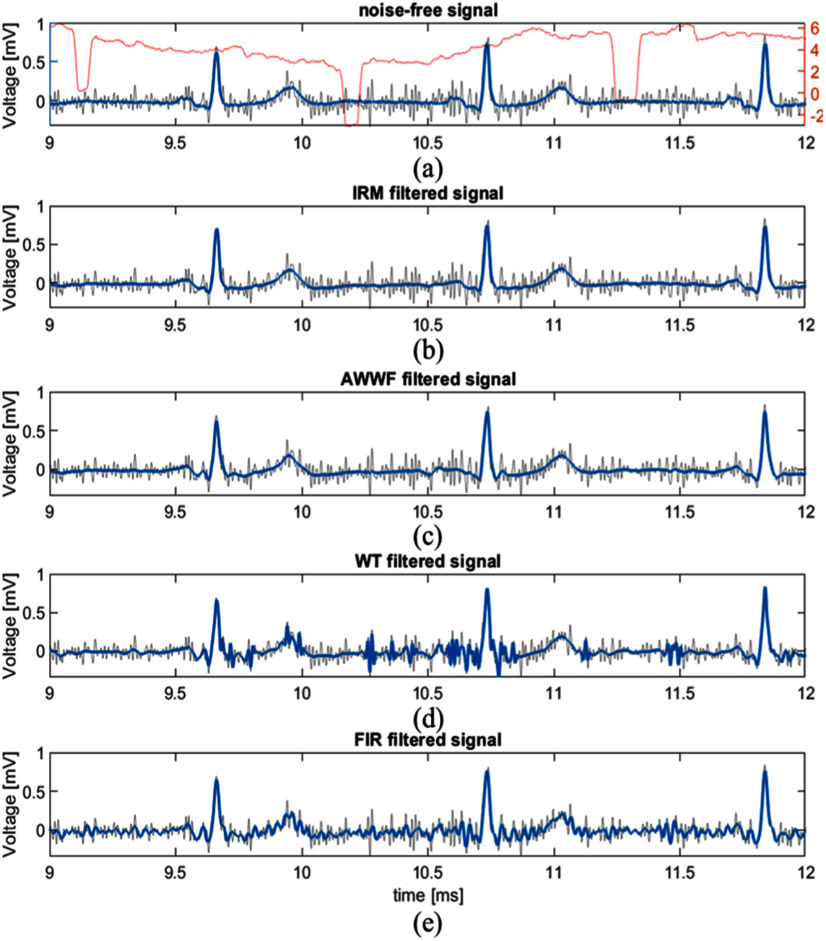
Fig. 3.
Example of different filtering methods applied on a typical signal from the SimEMG database. Each frame shows the original noise-contaminated signal (gray line). The red line in (a) shows SNR of the input signal (SNRIN) for 1-second window. SNRIN averages at 3.71 dB. The blue lines represent: (a) Recorded noise-free signal, (b) IRM-filtered signal, (c) AWWF-filtered signal, (d) WT-filtered signal, (e) FIR-filtered signal.

