
Figure 2. Agonism profiles at D2R.
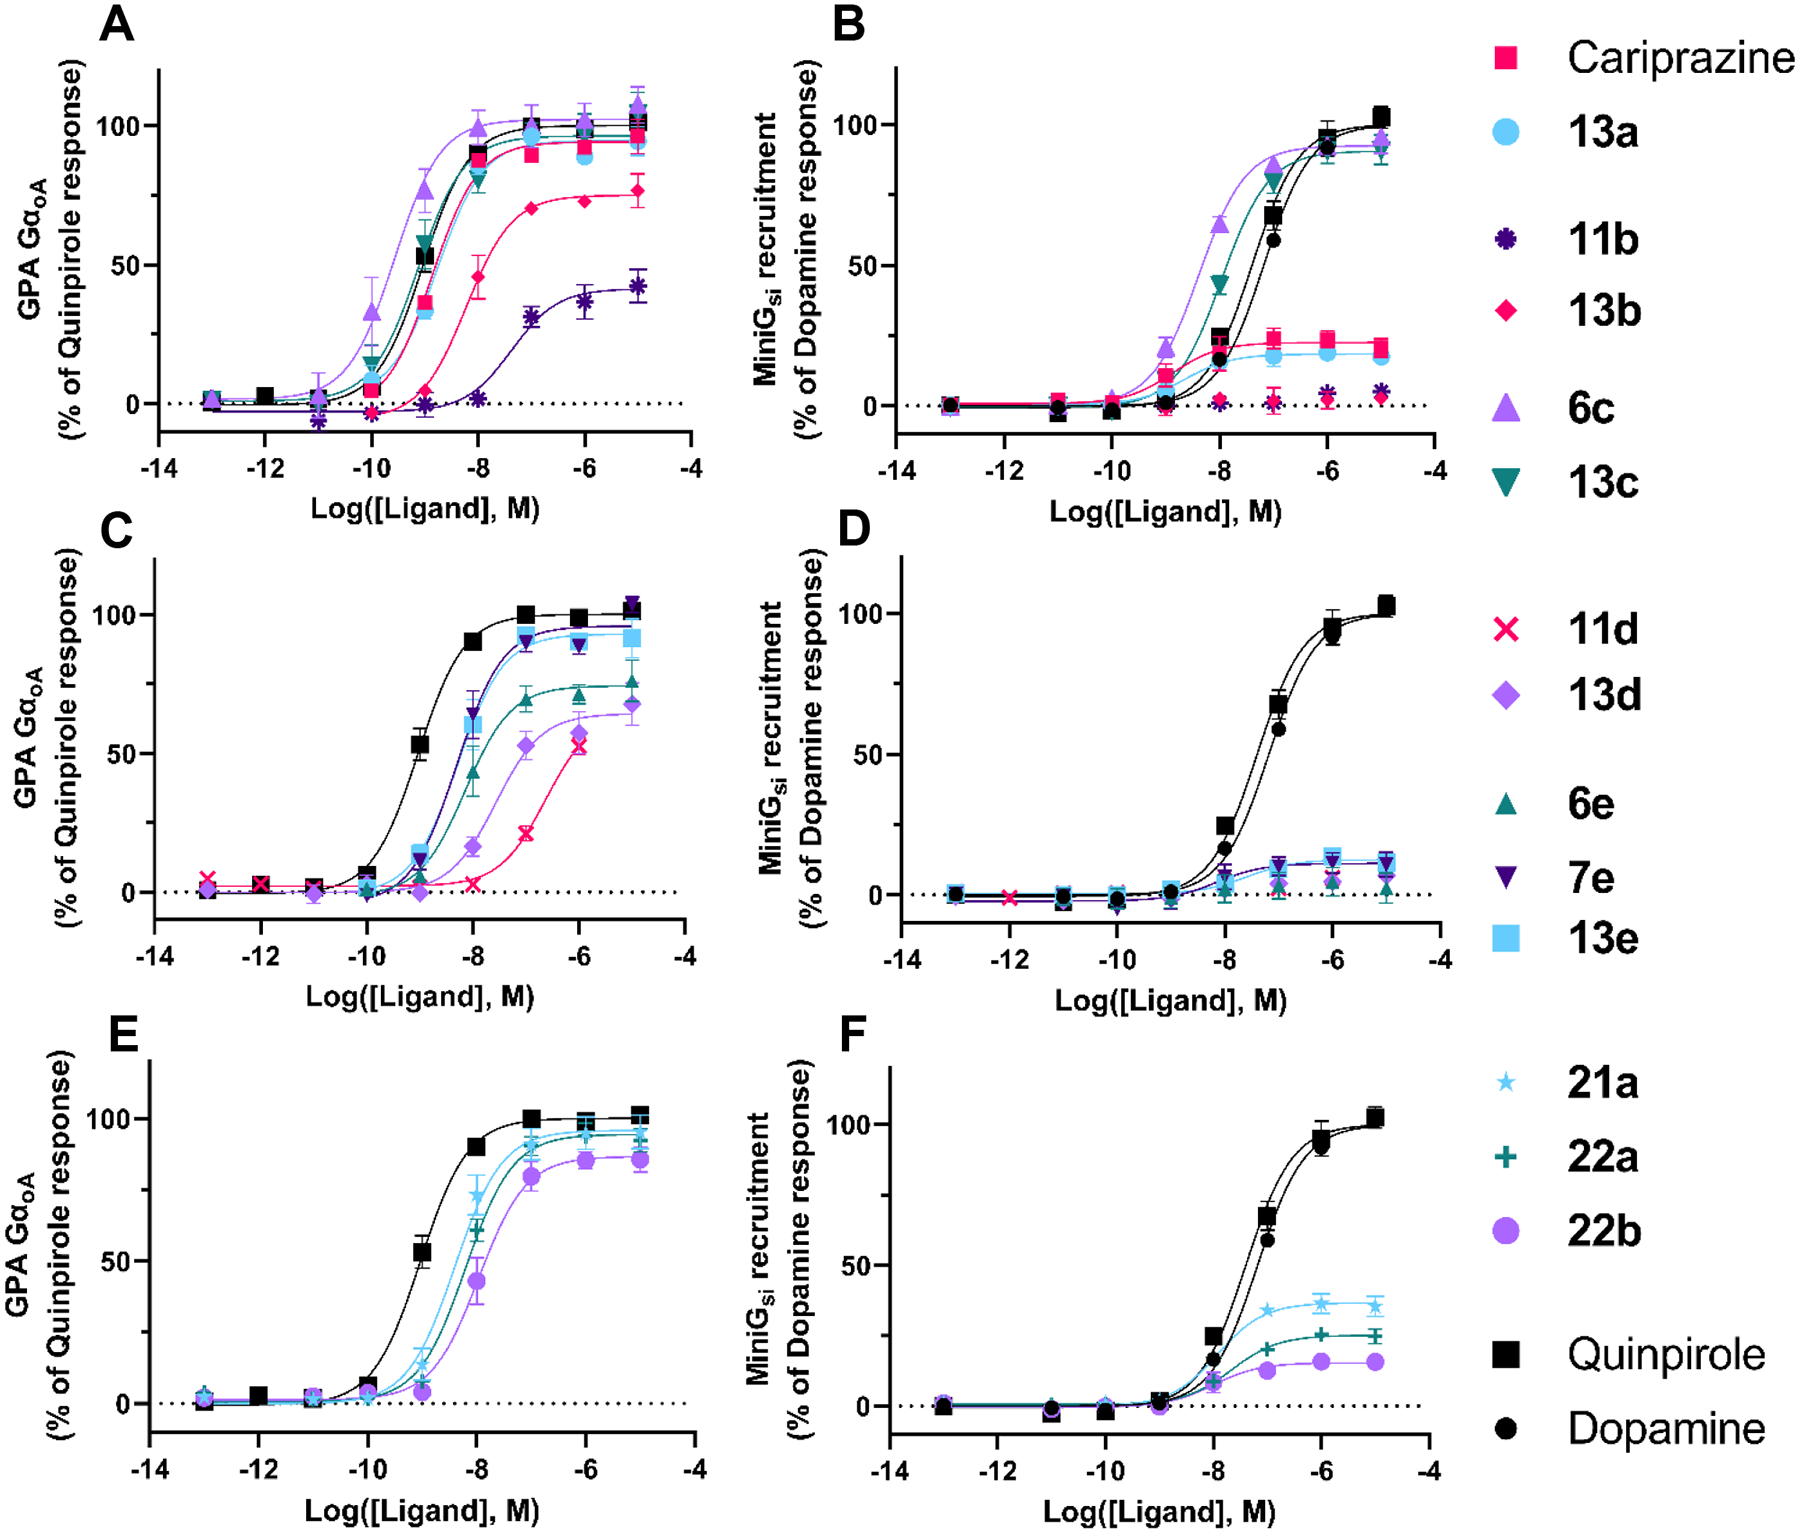
Two differents BRET assays were used to assess D2R activation: an amplified GαoA G protein (GPA GαoA) activation assay, shown on the left panels, and a less amplified miniG recruitment assay shown on the right panels. Each panel shows concentration response curves for a subset of the 14 selected ligands: 2,3-dichlorophenyl, 2-chloro-3-ethylphenyl, and 2-fluoro-3-methoxyphenyl compounds (A) GPA GαoA and (B) miniGsi; 2-trifluoromethyl substituted pyridine and 3-chloro-5-ethyl-2-methoxyphenyl compounds (C) GPA GαoA and (D) miniGsi; linker modified compounds (E) GPA GαoA and (F) miniGsi. Data points represent the mean ± SEM of three independent experiments performed in duplicate.