Table 1.
D3R and D2R binding affinities of cariprazine and its analogues.a

| ||||||
|---|---|---|---|---|---|---|
| compound | Ar | R | MPO | Ki ± SEM (nM) | D2R Ki / D3R Ki | |
| D2R | D3R | |||||
| 4a |
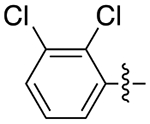
|

|
2.8 | 8.2 ± 2.6 | 2.13 ± 0.85 | 3.8 |
| cariprazine |

|
3.6 | 0.78 ± 0.17 | 0.22 ± 0.06 | 3.6 | |
| 7a |

|
3.5 | 1.21 ± 0.06 | 0.21 ± 0.02 | 5.7 | |
| 8a |

|
3.8 | 1.49 ± 0.03 | 0.26 ± 0.10 | 5.7 | |
| 9a |

|
2.8 | 1.86 ± 0.06 | 0.36 ± 0.05 | 5.1 | |
| 10a |

|
2.5 | 6.5 ± 1.9 | 0.31 ± 0.10 | 21 | |
| 11a |
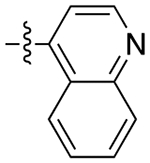
|
2.8 | 29 ± 13 | 0.66 ± 0.28 | 44 | |
| 12a |

|
2.8 | 3.75 ± 0.65 | 0.59 ± 0.13 | 6.4 | |
| 13a |

|
3.6 | 2.85 ± 0.63 | 0.14 ± 0.05 | 20 | |
| 6b |
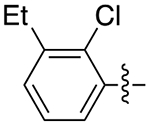
|

|
3.5 | 0.75 ± 0.07 | 0.26 ± 0.03 | 2.9 |
| 7b |

|
3.4 | 0.48 ± 0.11 | 0.18 ± 0.01 | 2.6 | |
| 9b |

|
2.8 | 0.87 ± 0.08 | 0.29 ± 0.08 | 3.0 | |
| 10b |

|
2.5 | 7.8 ± 1.9 | 1.31 ± 0.46 | 6.0 | |
| 11b |
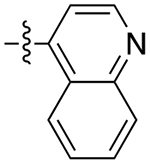
|
2.8 | 5.76 ± 0.93 | 0.34 ± 0.06 | 17 | |
| 12b |

|
2.8 | 1.80 ± 0.34 | 0.58 ± 0.07 | 3.1 | |
| 13b |

|
3.5 | 1.78 ± 0.18 | 0.25 ± 0.04 | 7.1 | |
| 6c |
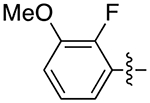
|

|
5.2 | 134 ± 17 | 9.4 ± 1.2 | 14 |
| 13c |

|
5.1 | 479 ± 26 | 1.31 ± 0.02 | 370 | |
| 6d |
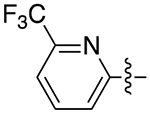
|

|
4.7 | 26.7 ± 5.4 | 2.38 ± 0.54 | 11 |
| 11d |
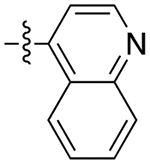
|
2.6 | 162 ± 48 | 1.00 ± 0.08 | 160 | |
| 13d |

|
4.6 | 127 ± 14 | 1.06 ± 0.08 | 120 | |
| 4e |
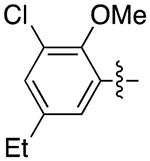
|

|
3.1 | 68.1 ± 4.3 | 38.8 ± 3.0 | 1.8 |
| 6e |

|
3.4 | 4.12 ± 0.17 | 1.76 ± 0.11 | 2.3 | |
| 7e |

|
3.3 | 5.8 ± 1.3 | 0.64 ± 0.10 | 9.1 | |
| 8e |

|
3.5 | 5.3 ± 1.8 | 0.78 ± 0.28 | 6.8 | |
| 10e |

|
2.3 | 114 ± 36 | 1.03 ± 0.26 | 110 | |
| 13e |

|
3.3 | 15.2 ± 2.0 | 0.73 ± 0.16 | 21 | |
Ki values are derived from IC50 values using the Cheng-Prusoff equation,50 and calculated as the mean of at least three independent experiments. The radioligand used in these assays was [3H]-N-methylspiperone.
