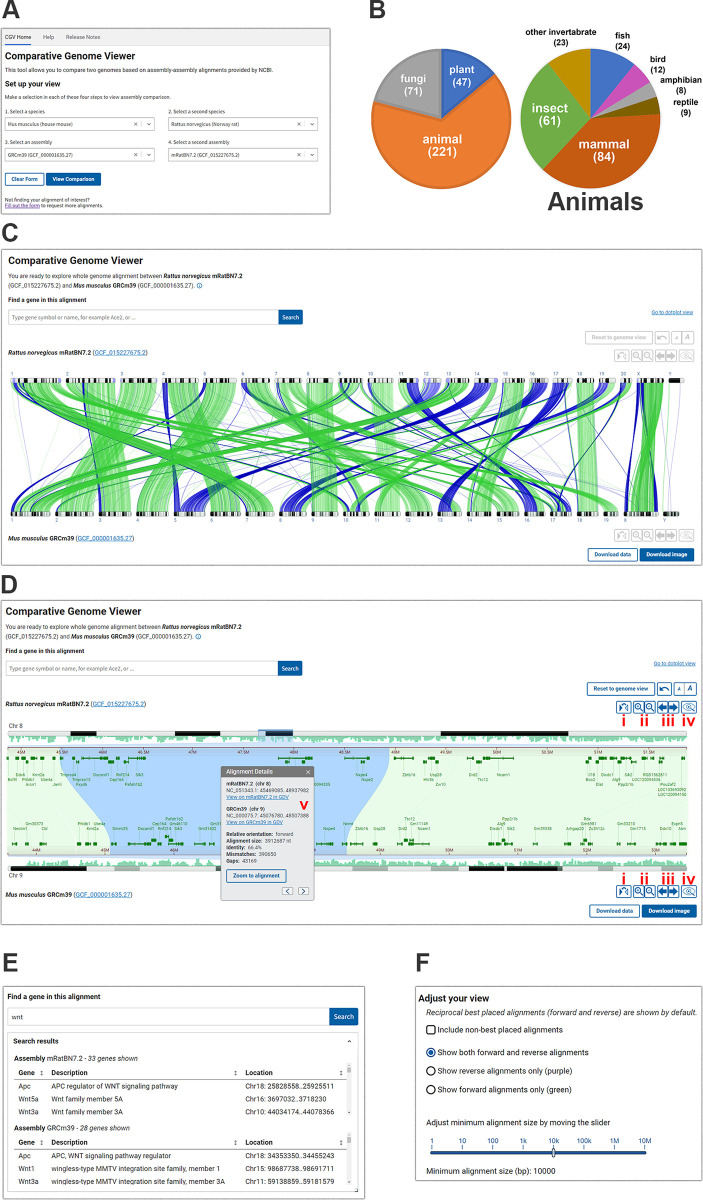
Fig 1. Overview of CGV.
(A) CGV selection menu. (B) Taxonomic distribution of species represented by alignments in CGV. Numbers in the pie charts are current as of February 5, 2024 (C) CGV ideogram view of whole-genome assembly alignment. Buttons in the lower right provide download access for complete whole-genome alignment data or an SVG image of the current alignment view. The view can be recreated at https://www.ncbi.nlm.nih.gov/genome/cgv/browse/GCF_015227675.2/GCF_000001635.27/27835/10116 (D) CGV zoomed to a chromosome-by-chromosome view, with an information panel shown. This panel can be viewed by clicking to select an alignment segment. (i) Flip orientation; (ii) zoom in/out; (iii) pan left/right; (iv) view assembly in GDV; (v) information panel. The view can be recreated at https://www.ncbi.nlm.nih.gov/genome/cgv/browse/GCF_015227675.2/GCF_000001635.27/27835/10116#NC_051343.1:44657546-50471623/NC_000075.7:41365809-52285446/size=10000. (E) CGV search interface and sample search results. (F) Adjust Your View configure options for the ideogram view. Webpage source: National Library of Medicine. CGV, Comparative Genome Viewer; GDV, Genome Data Viewer.

