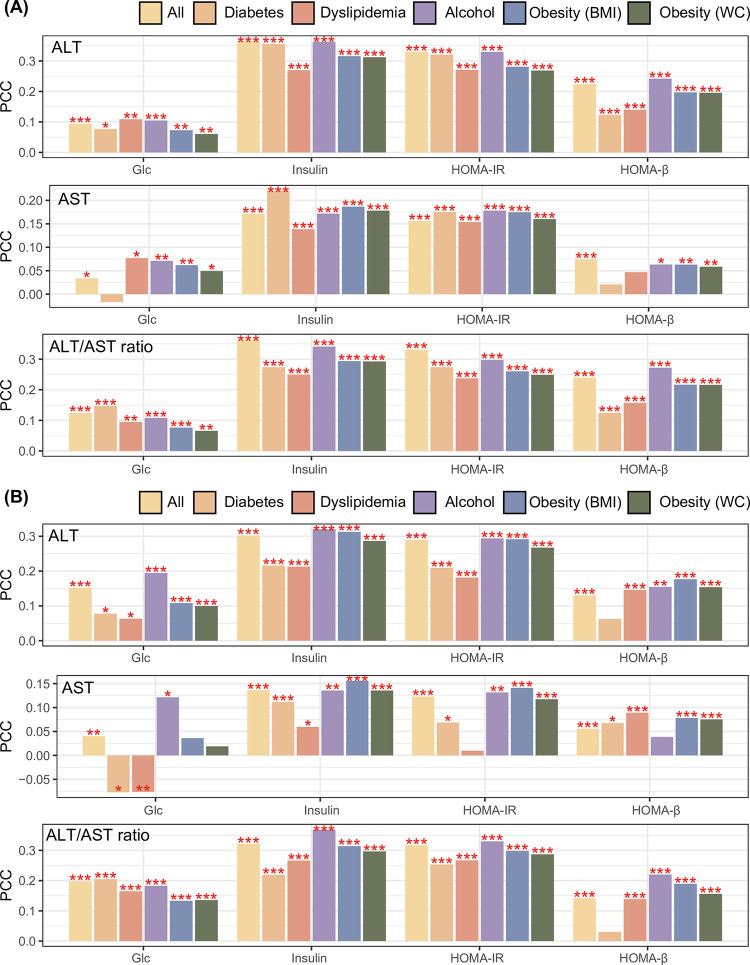
Fig 1.
Association between the liver enzyme profile and IR indices in (A) Korean men and (B) Korean women. *, **, and *** denote p-value < 0.05, p < 0.01, and p < 0.001, respectively, calculated by Pearson’s correlation method. Pearson’s correlation was used to identify the association of liver profiles, including ALT, AST, and their ratio, with the four IR indices. Correlation analysis was repeated six times with different combinations of participants (those with diabetes, dyslipidemia, alcohol consumption, general obesity, and abdominal obesity). Abbreviations: IR, insulin resistance; PCC, Pearson’s correlation coefficient; ALT, alanine aminotransferase; AST, aspartate aminotransferase; Glc, fasting blood glucose; HOMA-IR, Homeostasis model assessment for insulin resistance; HOMA-β, HOMA for β-cells.

