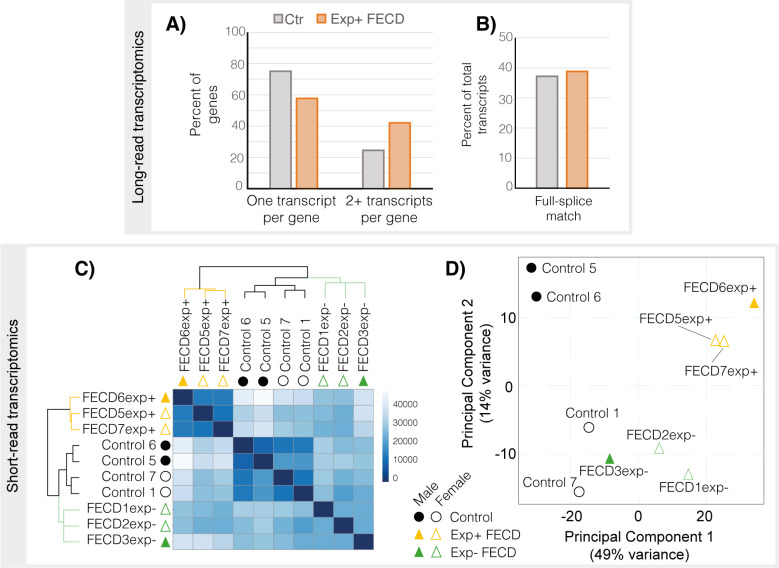
Fig 1. Exp+ FECD samples are transcriptomically distinct in both short- and long-read datasets when compared to controls.
A) Bar chart showing proportion of annotated genes in long read transcriptomic dataset with only one transcript detect vs 2 or more transcripts in Control and Exp+ samples. Exp+ long-read samples have a higher proportion of genes with more than one isoform identified. B) Proportion of annotated transcripts with full splice matches. Exp+ FECD and Control samples have similar percentages of full splice matches suggesting additional splicing diversity seen in Exp+ is not predominantly due to aberrant splicing. C) Hierarchical clustering heatmap of sample-to-sample distances within short-read RNA-Seq data. Darker colours denote higher similarities between samples, demonstrating that Exp+ and control are more similar within each subgroup than with other samples. Exp- shows a similar result but is less pronounced, likely due to differences in unidentified underlying genetic causes. D) Principal component plot (PCA) of all short-read samples with sex, disease state and ethnicity as covariates. All three subsets of data cluster separately in the PCA plot. Control samples appear as circles, FECD Exp+ appear as orange triangles, FECD Exp- appear as green triangles. Male individuals are represented as filled shapes while female individuals are outlined.

