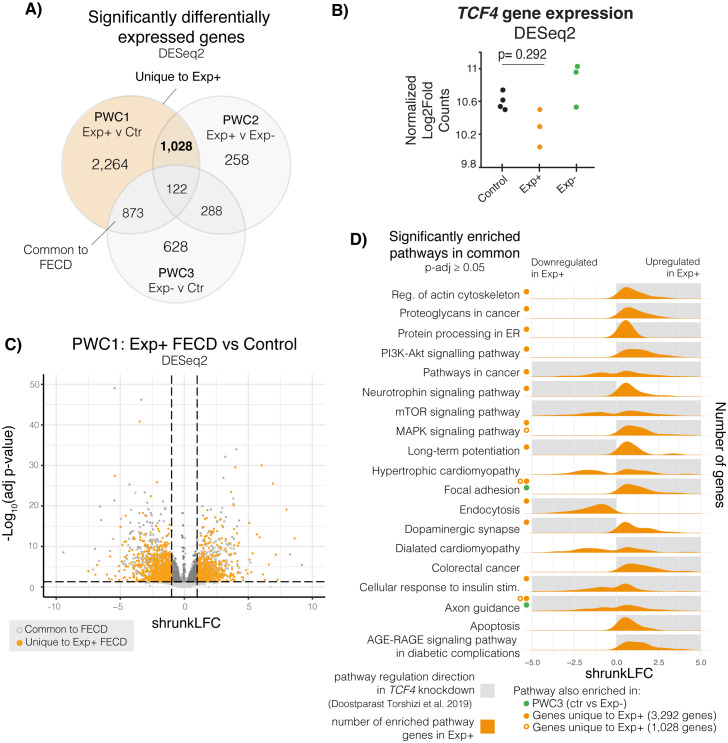
Fig 2. Differential gene expression analysis on Exp+ FECD, Exp- FECD, and control primary corneal endothelial cell (CEC) transcriptomes.
A) Differential gene expression was assessed via DESeq2. Three pairwise comparisons were conducted: PWC1 (Exp+ vs control), PWC2 (Exp+ vs Exp-), and PWC3 (Exp- vs control). Venn diagrams show overlap of significantly differentially expressed genes (adjusted p-value < 0.05) within these three comparisons. B) Total TCF4 expression showed no significant dysregulation between the different groups. C) Volcano plot shows the distribution of gene expression in Exp+ FECD compared to the control group. Horizontal dotted lines denote the boundary between significance (adjusted p-value < 0.05), whereas vertical dotted lines show a shrunkLFC cutoffs for -1 and 1. Dark grey solid markers show significantly expressed genes with a fold change magnitude greater than 1. Solid orange markers delineate uniquely Exp+ differentially expressed genes. D) Pathways enriched in Exp+ vs Control (g:profiler). Shaded grey boxes show direction of pathway enrichment in TCF4 knockdown models (Doostparast Torshizi et al. 2019) [33]. Green dots show pathways that are significantly enriched in PWC3 as well. Solid orange dots and open orange circle show that pathway enrichment persists in genes unique to Exp+ (1,028 genes and 3,292 genes, respectively).

