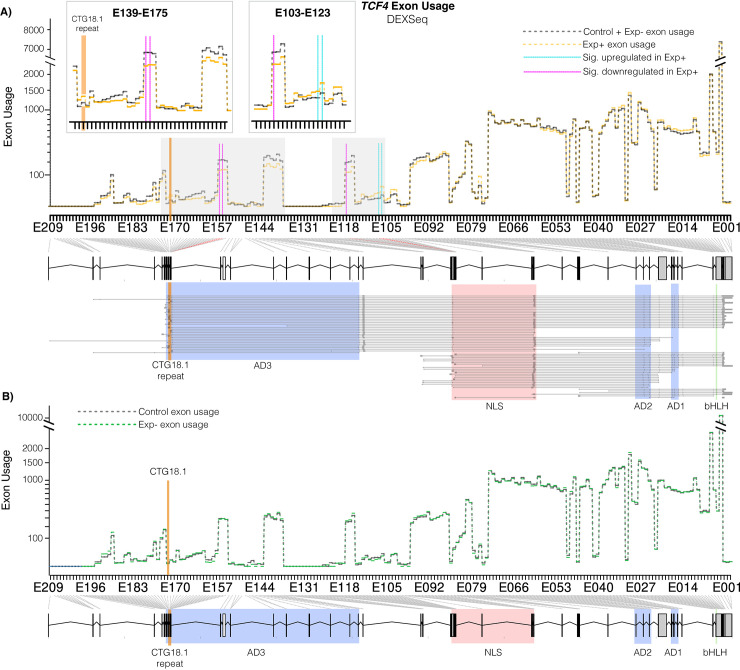
Fig 3. CTG18.1 expansion-mediated FECD results in alternative TCF4 exon usage within corneal endothelial cells (CECs).
A) Differences in exon usage between control (grey dotted line) and Exp+ (orange dotted line) CECs. Significantly upregulated and downregulated exons are highlighted with blue and red vertical lines, respectively. The location of CTG18.1 is depicted with an orange line. Inset boxes magnify dysregulated regions. A genomic schematic of TCF4 with transcripts aligned is presented below the axis. Key protein domains highlighted (green—basic helix loop helix (bHLH) domain, blue—activation domains (ADs), red—main nuclear localization signal (NLS). B) Differences in exon usage between control (grey dotted line) and Exp- (green dotted line) CECs. No exons were statistically dysregulated.

