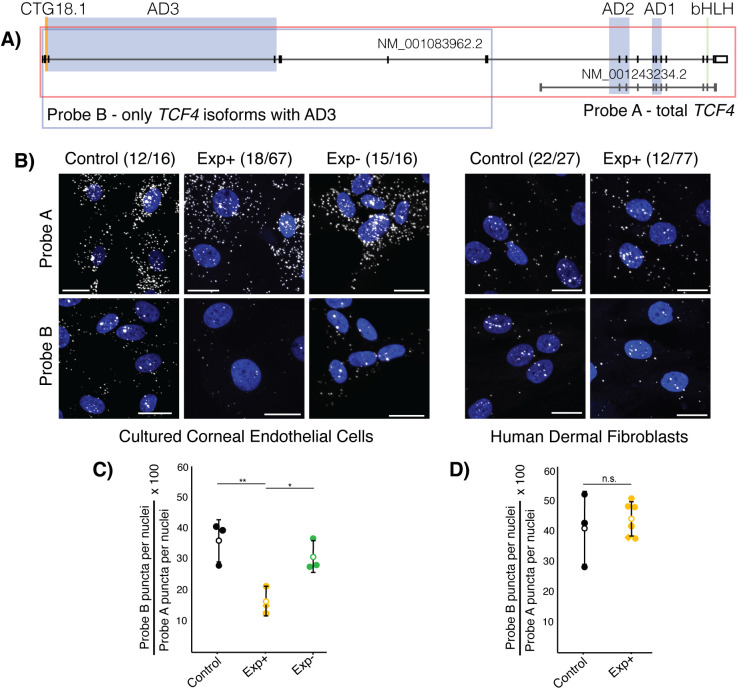
Fig 4. RNAScope probes targeting TCF4 transcripts demonstrate that longer transcripts containing activation domain 3 (AD3) account for a smaller proportion of total transcripts specifically in Exp+ FECD corneal endothelial cells (CECs).
A) Probe targeting schematic for TCF4. Probe A targets all exons in NM_001083962.2 and visualises total TCF4 transcripts, while Probe B targets only the 5’ exons, excluding those that are contained within shorter transcripts (NM_001243234.2). Probe B visualises the longer subset of AD3-containing transcripts within the cell. CTG18.1 is highlighted in orange. Green bar denotes TCF4 bHLH region, blue regions highlight TCF4 activation domains, red box shows the bipartite TCF4 NLS signal and orange shows the genomic region containing the CTG18.1 repeat. Key domains highlighted (green—basic helix loop helix (bHLH) domain, blue—activation domains (ADs), red—main nuclear localization signal (NLS)). B) Representative confocal images of Exp+, Exp- and control CECs and Exp+ and control fibroblasts with nuclei (blue, DAPI) and TCF4 puncta (visualised with Cy3 but represented here with white). Scale bars represent 20 μm. C) Plotting the proportion of longer AD3-containing TCF4 transcripts in Exp+ (orange), control (black), and Exp- (green) shows that Exp+ have significantly lower proportion of AD3-containing transcripts compared to both control (p = 0.0145) and Exp- (p = 0.0213) CECs, while there is no significant difference between control and Exp- (p = 0.362). D) Plotting the proportion of longer AD3-containing TCF4 transcripts in Exp+ (orange), and control (black) shows that there is no statistically significant (p = 0.61) difference in TCF4 isoform ratios between the two groups. Open circle denotes mean and error bars show standard deviation. Diamond datapoint shows bi-allelic expanded FECD cells. Significance determined with student T-test.

