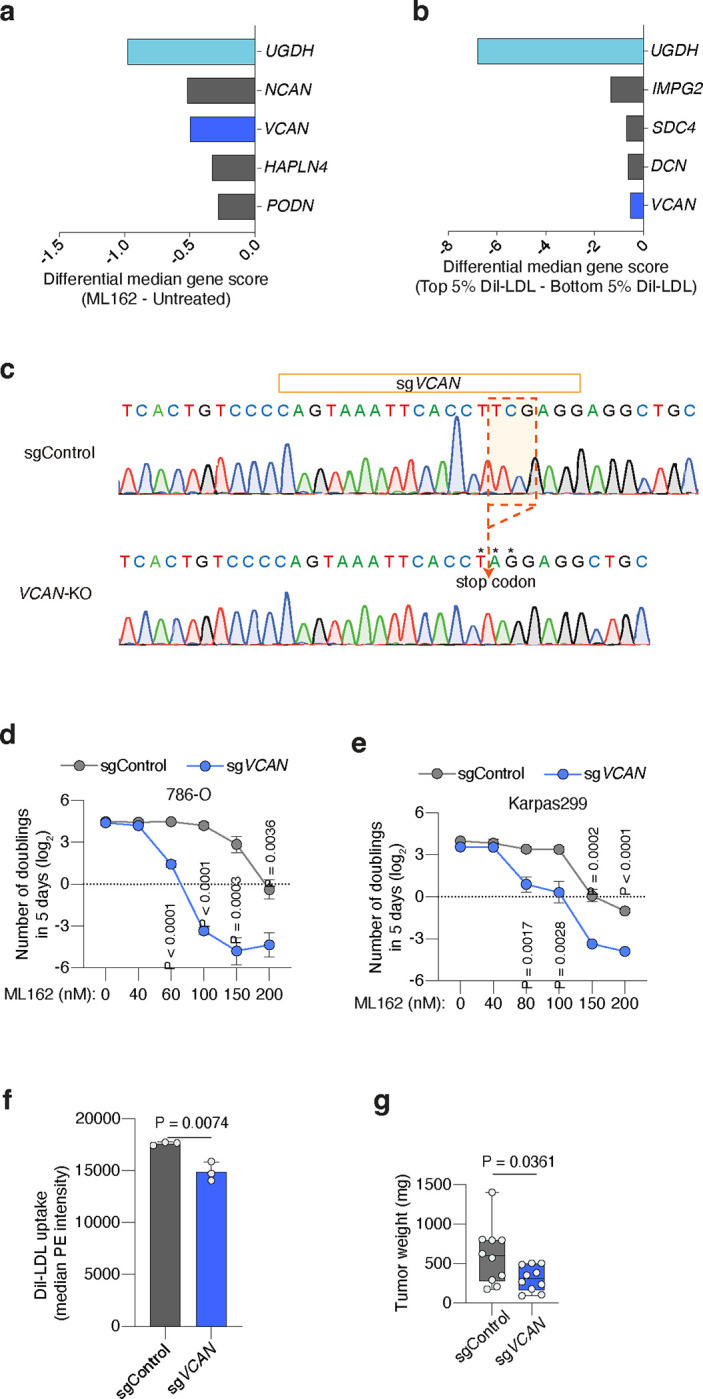
Extended Data Figure 6. The proteoglycan VCAN modestly increases resistance to ferroptosis and lipoprotein uptake in cancer cells.

a. Plot of differential gene scores under ML162 treatment relative to untreated cells. Negative scores represent genes whose loss potentiates ML162 toxicity. UGDH was included as a positive control (light blue). VCAN (blue) was a common hit between the two screens.
b. Plot of differential gene scores in high DiI-LDL uptake population compared to low DiI-LDL cells. Negative scores represent genes whose loss reduce cellular DiI-LDL uptake. UGDH was included as a positive control (light blue) and VCAN (blue) was a common hit between the two screens.
c. Sanger sequencing of VCAN gene exon 9 in Karpas299 parental cells (WT) or transduced with sgUXS1.
d. Number of doublings (log2) in 5 days of 786-O transduced with a sgControl (grey) or sgVCAN (blue) under the indicated concentrations of the GPX4 inhibitor ML162.
e. Number of doublings (log2) in 5 days of Karpas299 cells transduced with a sgControl (grey) or sgVCAN (dark blue) under the indicated concentrations of the GPX4 inhibitor ML162.
f. Cellular uptake of DiI-LDL measured as median PE intensity in the indicated Karpas299 cells transduced with a sgControl (grey) or sgVCAN (blue) assessed by flow cytometry.
g. Tumour weight resulting from implantation of Karpas299 cells transduced with a sgControl (grey) or sgVCAN (blue) in 6–12 weeks old immunodeficient mice.
d-g, Bars or lines represent mean ± s.d.; d-g, n=3 biologically independent samples. Statistical significance determined by two-tailed unpaired t-tests.
