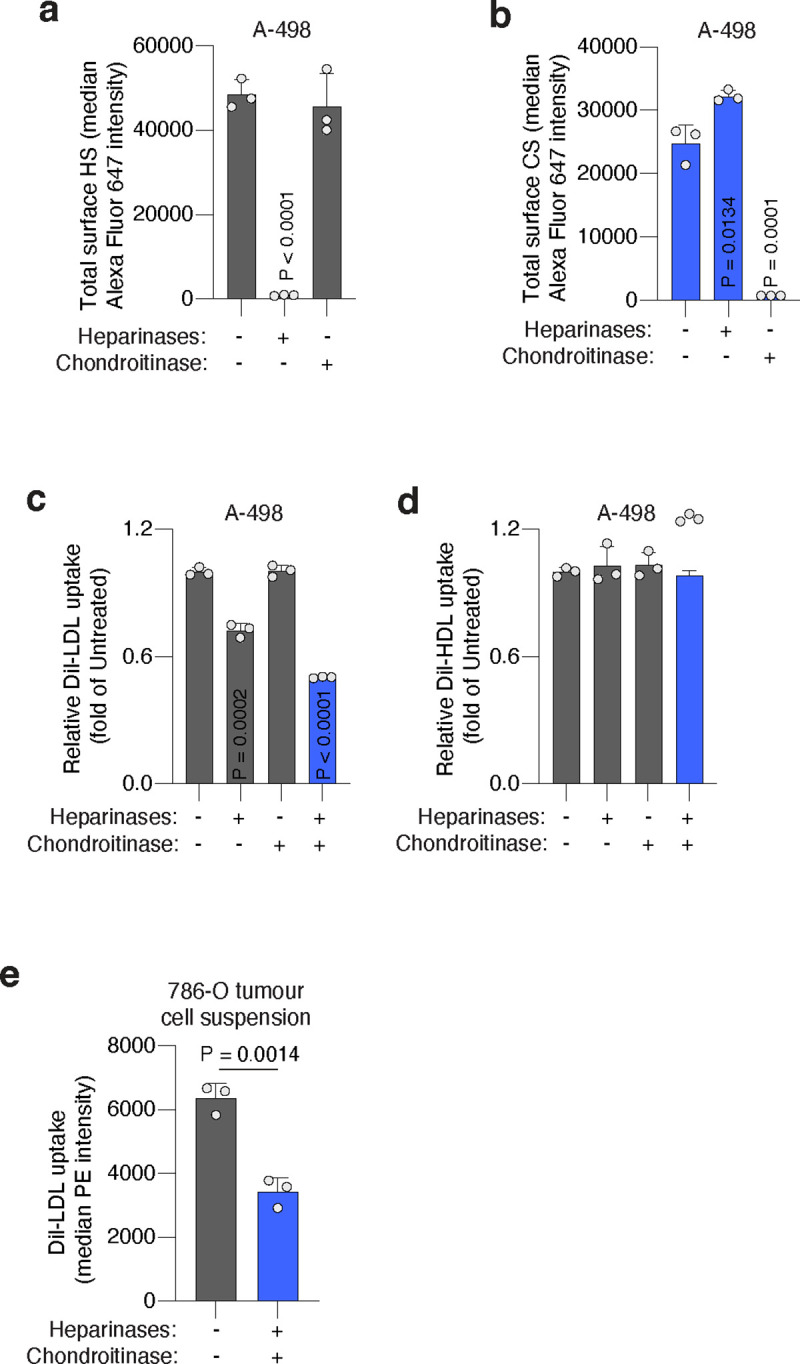
Extended Data Figure 7. Cell-surface sulfated glycosaminoglycans promote lipoprotein uptake.

a. Total cell surface HS measured as median Alexa Fluor 647 intensity in A-498 cells treated or not with heparinases (0.1 U/mL) or chondroitinases (0.1 U/mL) assessed by flow cytometry.
b. Total cell surface CS measured as median Alexa Fluor 647 intensity in A-498 cells treated or not with heparinases (0.1 U/mL) or chondroitinases (0.1 U/mL) assessed by flow cytometry.
c. Fold change in DiI-LDL uptake of A-498 cells upon treatment with heparinases (0.1 U/mL), chondroitinases (0.1 U/mL), or both (blue), relative to uptake of untreated cells assessed by flow cytometry.
d. Fold change in DiI-HDL uptake of A-498 cells upon treatment with heparinases (0.1 U/mL), chondroitinases (0.1 U/mL), or both (blue), relative to uptake of untreated cells, assessed by flow cytometry.
e. Uptake of DiI-LDL measured as median PE intensity in a cell suspension of 786-O xenograft tumour fresh tissue resected from mice left untreated (grey) or after combined treatment with heparinases (1.0 U/mL) and chondroitinases (1.0 U/mL) (blue) assessed by flow cytometry.
a-e, Bars represent mean ± s.d.; a-e, n=3 biologically independent samples. Statistical significance determined by two-tailed unpaired t-tests as indicated or compared to untreated cells (a-d).
