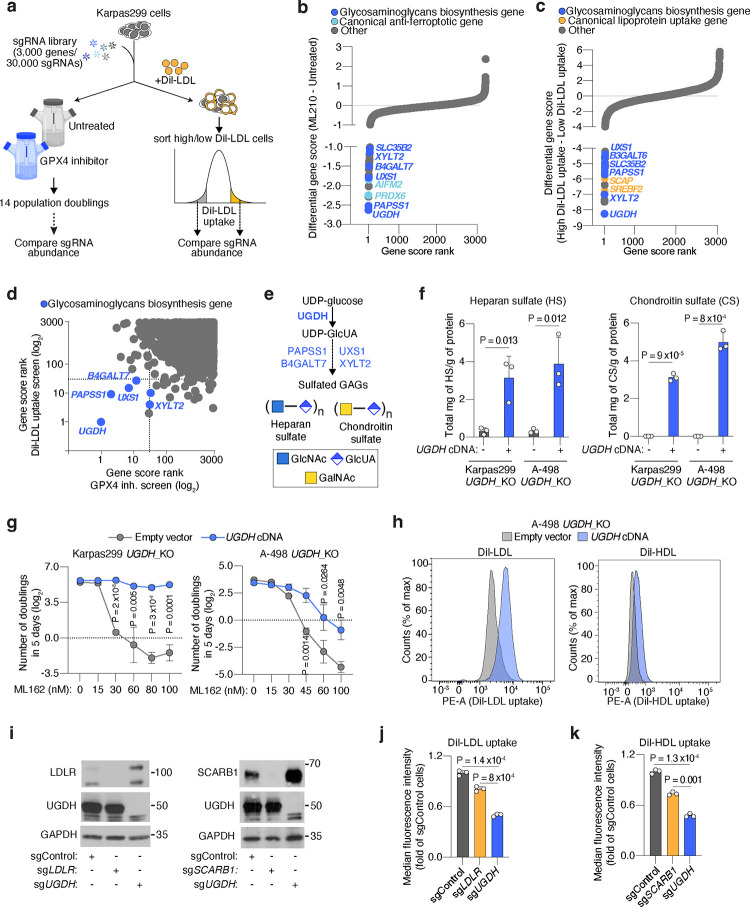
Figure 2. Cancer cells depend on the biosynthesis of glycosaminoglycans (GAGs) to take up lipoproteins, resist ferroptosis, and grow as tumours.
a. Schematic of parallel CRISPR screens in Karpas299 lymphoma cells transduced with a metabolism-focused sgRNA library (3,000 genes). First, a proliferation-based screen in the presence or absence of a GPX4 inhibitor (ML210) during 14 population doublings (left); second, a FACS-based screen where cells were incubated with DiI-LDL for 2 hours and subjected to sorting for 5% highest and 5% lowest fluorescent cells (right).
b. Rank of most essential genes under ML210 treatment compared to untreated Karpas299 cells. Canonical anti-ferroptotic genes are shown in light blue, and glycosaminoglycan biosynthesis genes are shown in dark blue.
c. Rank of most essential genes for DiI-LDL uptake in Karpas299 cells. Lipoprotein uptake genes are shown in orange and glycosaminoglycan biosynthesis pathway genes are shown in dark blue.
d. Gene scores ranks for the GPX4 inhibition and DiI-LDL uptake screens in Karpas299. All genes essential in both screens are part of the glycosaminoglycan biosynthesis pathway (dark blue).
e. Glycosaminoglycans, such as heparan sulfate and chondroitin sulfate, are formed by disaccharides repeats containing glucuronic acid (GlcUA) and other monosaccharides. The most upstream and rate-limiting enzyme of this pathway is UGDH. All genes in the pathway that scored in CRISPR screens are highlighted in blue.
f. Quantification of total milligrams of heparan sulfate (HS, left) and chondroitin sulfate (CS, right) per grams of protein in the indicated UGDH_KO cell lines expressing a sgRNA resistant UGDH cDNA (blue) or an empty vector (grey).
g. Number of doublings in 5 days (log2) of the indicated UGDH_KO cell lines expressing a sgRNA resistant UGDH cDNA (blue) or an empty vector (grey) under the indicated concentrations of the GPX4 inhibitor, ML162.
h. Representative flow cytometry plots showing the cellular uptake of DiI-LDL (left) or DiI-HDL (right) in A-498 UGDH_KO cells expressing a sgRNA resistant UGDH cDNA (blue) or an empty vector (grey). i. Immunoblot analysis of LDLR, SCARB1, and UGDH in HeLa cells transduced with a sgControl, sgLDLR, sgSCARB1 or sgUGDH. GAPDH is included as a loading control.
j. Fold change in the uptake of DiI-LDL of the indicated HeLa cell lines relative to sgControl-transduced cells assessed by flow cytometry.
k. Fold change in the uptake of DiI-HDL of the indicated HeLa cell lines relative to sgControl-transduced cells assessed by flow cytometry.
f, g, j, k, Bars or lines represent mean ± s.d.; f, g, j, k, n=3 biologically independent samples. Statistical significance determined by two-tailed unpaired t-tests.

