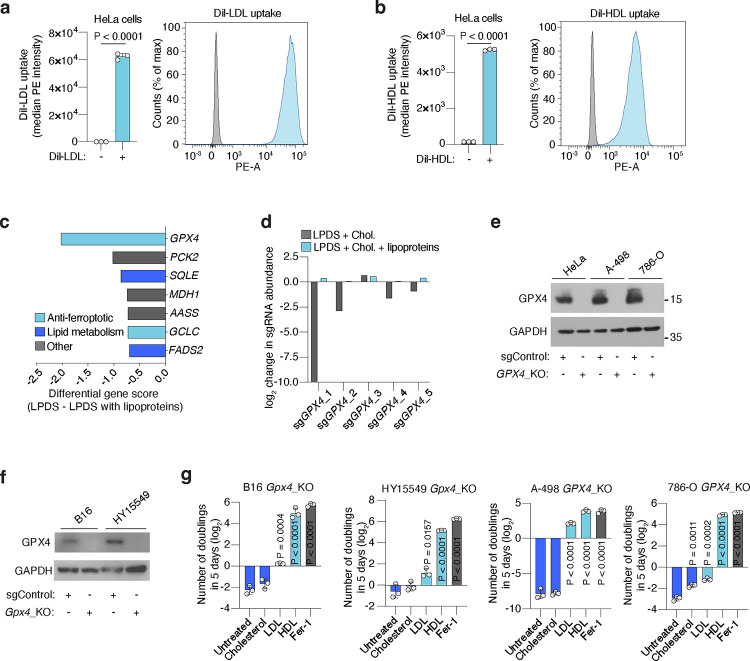
Extended Data Figure 1. GPX4 loss is compensated by lipoprotein supplementation.
a. Cellular uptake of DiI-LDL in HeLa cells measured as median PE intensity after incubation or not with DiI-LDL (left). Representative flow cytometry plot of HeLa cells treated (blue) or not (grey) with DiI-LDL (right).
b. Cellular uptake of DiI-HDL in HeLa cells measured as median PE intensity after incubation or not with DiI-HDL (left). Representative flow cytometry plot of HeLa cells treated (blue) or not (grey) with DiI-HDL (right).
c. Plot of differential gene scores in HeLa cells supplemented with lipoproteins (LPDS + lipoproteins) or not (LPDS). Anti-ferroptotic genes are shown in light blue and lipid metabolism genes are shown in dark blue. LPDS: lipoprotein-depleted serum.
d. Individual sgRNA scores (log2) for GPX4 under indicated conditions.
e. Immunoblot analysis of human GPX4 sgControl cells or GPX4_KO isogenic lines. GAPDH is included as a loading control.
f. Immunoblot analysis of mouse GPX4 sgControl cells or Gpx4_KO isogenic lines. GAPDH is included as a loading control.
g. Number of doublings (log2) in 5 days of indicated GPX4-deficient cell lines in vitro either untreated or supplemented with cholesterol (5 μg/mL), LDL (50 μg/mL), HDL (50 μg/mL) or Fer-1 (1 μM).
A, b, g, Bars represent mean ± s.d.; a, b, g, n=3 biological replicates. Statistical significance determined by two-tailed unpaired t-tests as indicated or compared to untreated cells (g).

