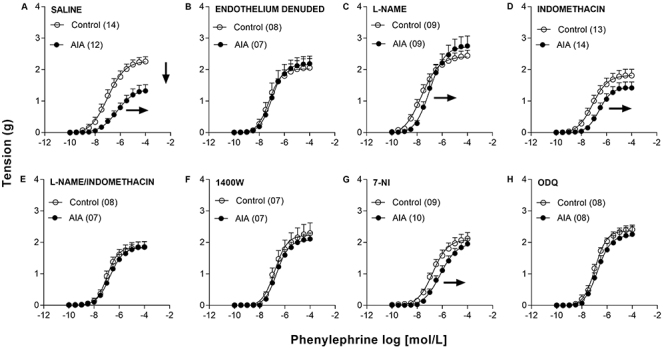
Figure 4. Concentration-response curves for phenylephrine determined in isolated thoracic aorta preparations obtained from animals of the Control and adjuvant-induced arthritis (AIA) groups 15 days after induction/false induction, endothelium-intact (A), or denuded (B) stimulated by vehicle or endothelium-intact and stimulated by 10-4 mol/L L-NAME (C), 10-5 mol/L indomethacin (D), 10-4 mol/L L-NAME + 10-5 mol/L indomethacin (E), 10-6 mol/L 1400W (F), 10-4 mol/L 7-NI (G), or 10-6 mol/L ODQ (H). Data are reported as means±SE. The last point of each concentration-response curve is equivalent to the maximum contractile responses (Emax). In parentheses is number of animals in each group. Vertical arrow indicates AIA-induced reduction in terms of Emax and horizontal arrows indicate AIA-induced reduction in terms of the negative logarithm (pEC50) of the half maximal effective concentration (EC50) (see Table 1).

