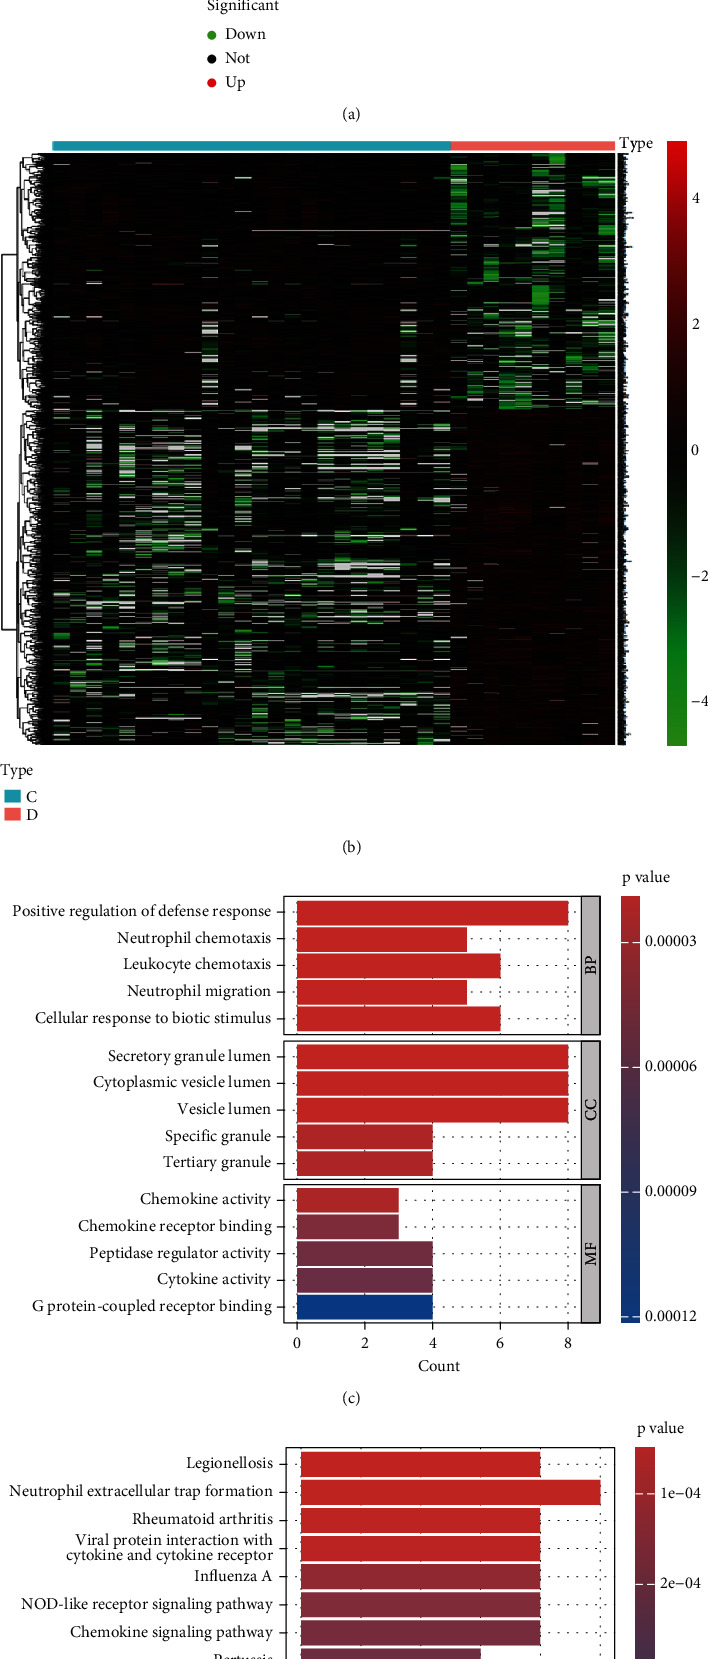
Figure 1.

Differential expression analysis in DKD tubulointerstitial injury. (a) Volcano plot depicting the DEG profiles between diabetic tubulointerstitial injury samples and healthy controls. (b) Heat map representation of the 50 most upregulated and 50 most downregulated DEGs. Enrichment analysis of functional annotations for DEGs. (c) Top 5 enriched functional terms in biological processes (BP), cellular components (CC), and molecular functions (MF). (d) Pathway enrichment analysis using KEGG for DEGs.
