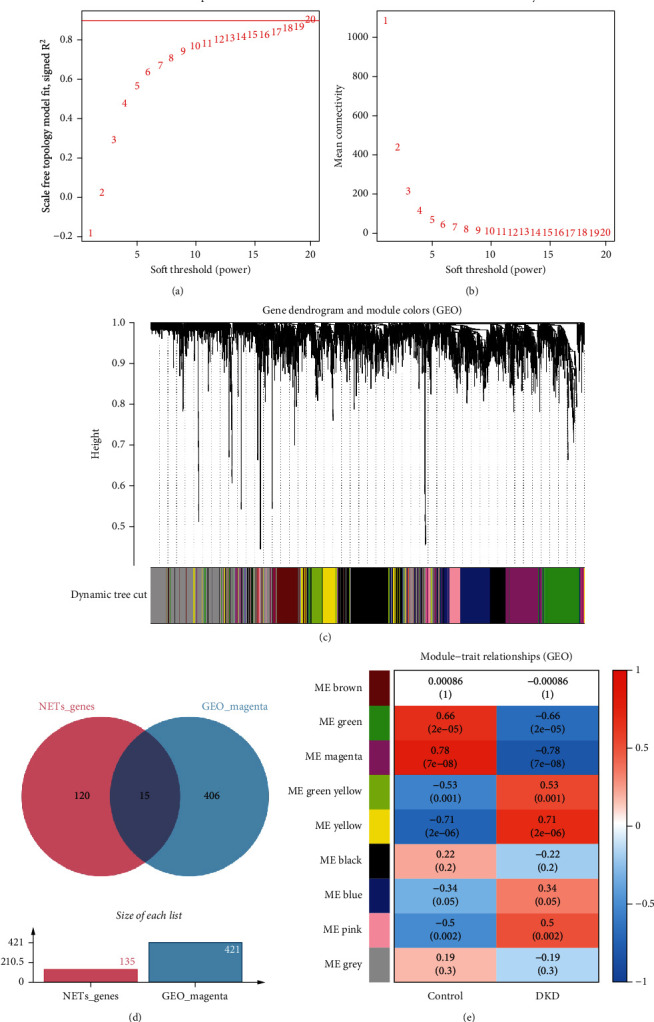
Figure 2.

Network construction and module detection in GSE30122 using WGCNA. (a) Selection of the soft-thresholding power in WGCNA. (b) Analysis of network connectivity within WGCNA. (c) The WGCNA generated a cluster dendrogram. Identification of candidate hub genes. (d) The Venn diagram illustrating the overlap between the magenta module and NRGs. (e) Cluster dendrogram of gene modules from WGCNA.
