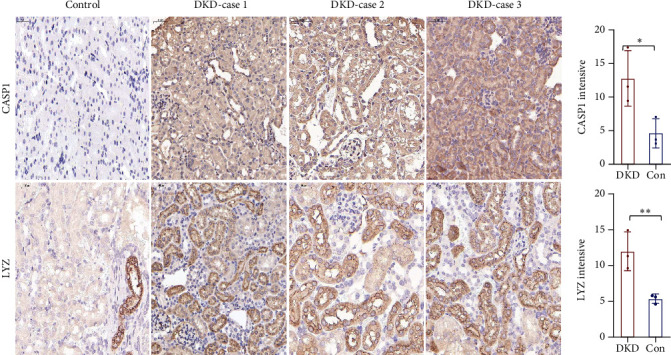
Figure 6.

Immunohistochemistry of NRGs in mouse kidney tissues. Representative images of CASP1 and LYZ immunohistochemical staining in renal sections from diabetic kidney disease (DKD) and nondiabetic control mice (200x magnification, scale bar 50 μm). ∗p < 0.05 and ∗∗p < 0.01 compared to nondiabetic controls.
