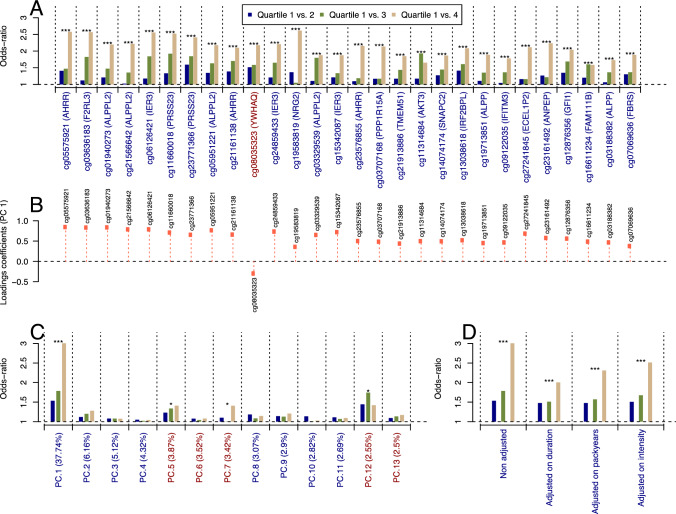
Fig. 2.
Odds ratios (ORs) calculated from the methylation M value at the 28 bladder-related CpG sites, which was recoded into quartiles. a The loadings coefficients of the first component of the Principal Component Analysis of the 28 methylation levels are presented in panel b. Using the same quartile discretisation for the scores of the 13 first components (jointly explaining 80.69% of the total variance), we calculated the OR for each component (panel c). The OR derived from the score of the first component were further adjusted for smoking duration, cumulative smoking exposure (in packyears), and smoking intensity (panel d). For all calculated OR, a linear model was used to test for a trend in the OR across methylation quartiles. For readability, corresponding p-values were coded as * for p-values in [0.05, 0.01], ** for p-values in [0.01, 0.001], and *** for p-values < 0.001. To ensure comparability across OR estimates, these were calculated setting the lowest quartile as reference, and derived the OR from the absolute value of the effect size estimate. As such, for CpG sites (or PC scores) found inversely associated to bladder cancer risk (marked in blue), the reported OR represents the risk change per-unit loss in methylation (or score), and for CpG sites found directly associated to disease risk (marked with a red), the OR represents the risk change per unit increase in methylation level (or score)

