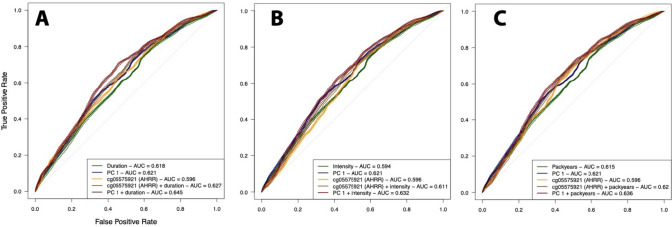
Fig. 5.
Receiver-Operating-Curve (ROC) analyses summarising the logistic model for smoking duration (a), smoking intensity (b), and pack-years (c), ROC curves are presented for the model including (i) the smoking metrics alone (green), (ii) the scores of the first principal component of the 28 CpG sites found differentially methylated in relation to smoking status (PC1 explaining 37.7% of the total variance, in blue), (iii) methylation levels at cg05575921 (AHRR), the CpG site exhibiting the strongest association with smoking status in our data (orange), (iv) methylation levels at cg05575921 and the smoking exposure metric (brown), and (v) PC1 scores and the smoking exposure measurement (dark red). We report the area under the curved from the testing set (20% of the total population) for each of the model investigated

