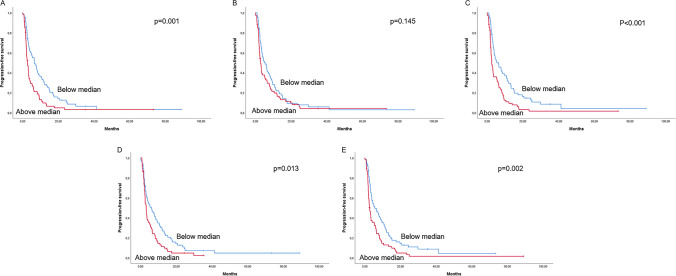
Fig. 1.
Univariate progression-free survival (PFS) analysis. A PFS according to HMGA1 gene expression; B PFS according to HMGA2 gene expression; C PFS according to HMGB1 gene expression: D PFS according to HMGB2 gene expression; and E PFS according to HMGB3 gene expression. The groups were defined according to the median of gene expression: above (N = 66) and below (N = 67) the median. Log‐rank test statistical significance was defined at p ≤ 0.05

