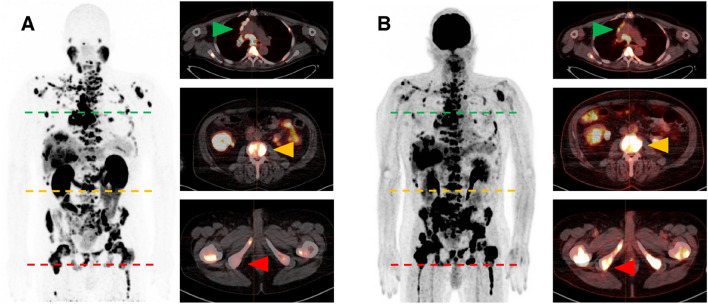
Figure 4.
Representative whole-body and transversal slice images from (A) baseline [68Ga]Ga-PSMA-11 PET/CT scan and (B) baseline [18F]FDG-PET/CT scan of a mCRPC patient showing different patterns of [68Ga]Ga-PSMA-11 uptake and [18F]FDG uptake in different lesions. Green arrows denote lymph node metastases with intense [68Ga]Ga-PSMA-11 and moderate [18F]FDG uptake. Yellow arrows indicate bone metastases with intense uptake of both radiotracers. Red arrows indicate bone metastases with faint [68Ga]Ga-PSMA-11 uptake but intense [18F]FDG uptake.

