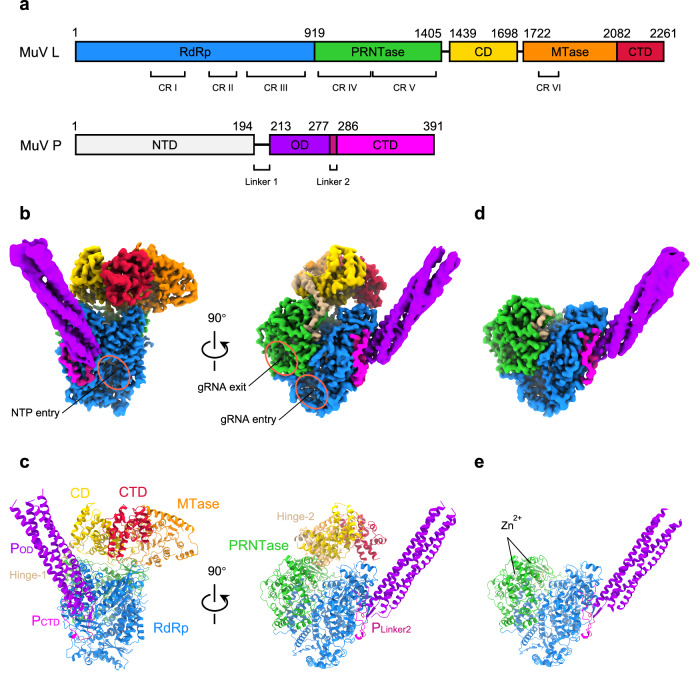
Fig. 1. Structures of MuV L–P complex.
a Diagram of MuV L and P domains. RdRp, PRNTase, Hinge regions (Hinge-1&2), CD, MTase, and CTD of L are colored in blue, green, tan, gold, orange, and crimson, respectively. NTD, OD, Linker region 2 (Linker2), and CTD of P are colored in light gray, purple, violet red, and magenta, respectively. The same color strategy is used throughout the manuscript unless specified. CR I–VI: six conserved regions in L. b Cryo-EM density maps of MuV Lintegral–P (EMD-35864). NTP entry, genomic RNA (gRNA) entry, and gRNA exit are circled. c Atomic models of MuV Lintegral–P (PDB ID 8IZL). d Cryo-EM density map of MuV Lbody–P (EMD-37964). e Atomic model of MuV Lbody–P (PDB ID 8X01). Maps in (b, d) are the composite cryo-EM maps of MuV Lintegral–P and Lbody–P to improve the interpretability, after post-processing in DeepEMhancer69. These are also utilized for other figure preparation. Models in (c, e) are the composite atomic models of MuV Lintegral–P and Lbody–P via rigid body docking of individual models into their respective composite cryo-EM maps, which are B-factor sharpened.

