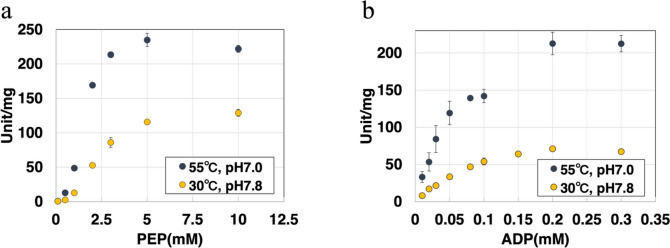
Fig. 5.
Saturation curves of Synechocystis pyruvate kinase 2 (SyPyk2) for phosphoenolpyruvate (PEP) and adenosine diphosphate (ADP). a The saturation curves of SyPyk2 for PEP. These measurements were performed in an optimum condition at 55 °C and pH 7.0 in MES-NaOH buffer (blue) or an intracellular condition of 30 °C and pH 7.8 in Tris–HCl (yellow). The ADP concentration was 2.0 mM. The mean ± SD values were calculated from three independent experiments. b The saturation curves of SyPyk2 for ADP. These measurements were performed in an optimum condition at 55 °C and pH 7.0 in MES-NaOH buffer (blue) or an intracellular condition of 30 °C and pH 7.8 in Tris–HCl (yellow). The PEP concentration was 5 mM. The concentrations of KCl and MgCl2 were 100 and 15 mM, respectively. The mean ± SD values were calculated from three independent experiments

