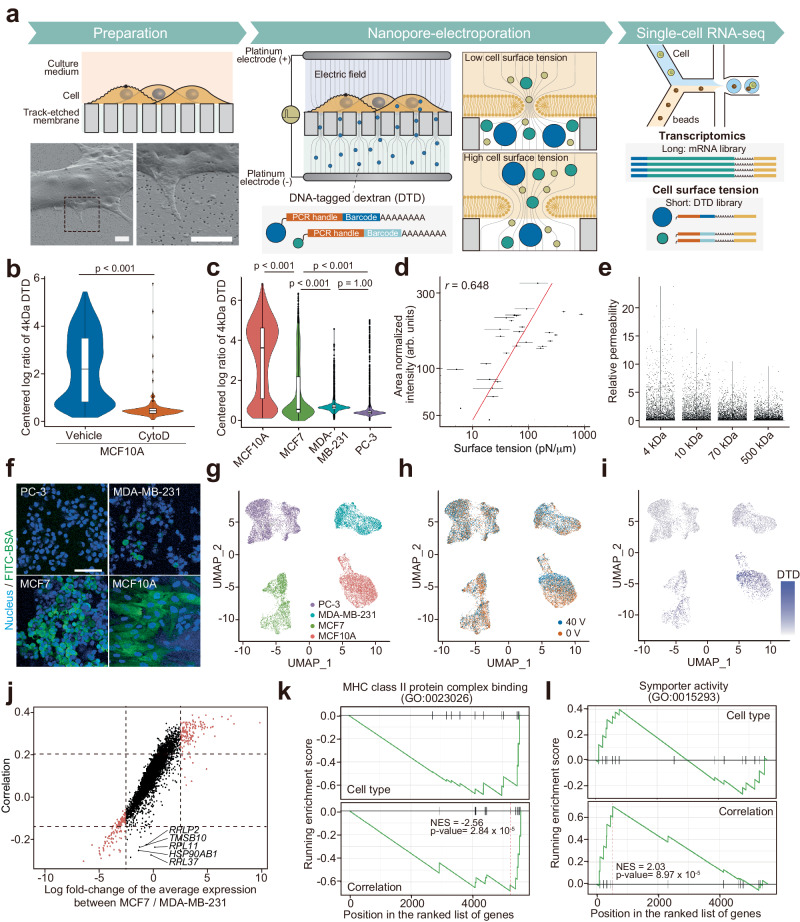
Fig. 1. ELASTomics enables simultaneous detection of single-cell surface tension coupled with transcriptomes.
a Workflow of ELASTomics. (Preparation) Cells are cultured on the track-etched membrane coated by fibronectin. The lower left panel is field emission scanning electron microscopy (FE-SEM) images of MCF7 cells on a track-etched membrane, and the lower right panel is zoom-up views of the dotted box in the lower left panel. An independent duplicate experiment has verified similar results at a different angle of FE-SEM imaging. Scale bars, 2 μm. (Nanopore-electroporation) Cells are subjected to pulsed electric fields that are created in the vicinity of nanopores to import DNA-tagged dextran (DTD) into the cells. The cell surface tension of the lipid bilayer affects the diameter of the pore formed in a lipid bilayer. The amount of imported DTD thus dictates the surface tension of individual cells. (Single-cell RNA-seq) Single-cell RNA-sequencing (scRNA-seq) workflow creates libraries of transcriptomics (mRNA library) and cell surface tension (DTD library). b Centered log ratios of 4 kDa DTD imported into MCF10A cells with or without cytochalasin D treatment. c Centered log ratios of 4 kDa DTD imported into four cell lines (MCF10A, MCF7, MDA-MB-231, and PC-3). For boxplot overlaid on a violin plot (b and c), the center line is the median, the box indicates the first and third quartiles, whiskers are minimum/maximum values excluding outliers, and dots are outliers. d Normalized intensity of FITC-labeled bovine serum albumin (FITC-BSA) and cell surface tension measured by atomic force microscopy in each nanopore-electroporated MCF10A cell (n = 28 independent cells examined in four independent experiments). The coefficient of Pearson’s correlation (two-tailed) is r = 0.648. Error bars of surface tension are presented as mean ± SE for n = 2 to 44 times of each cell. The red line represents the regression curve. e Relative permeability of different DTDs (4, 10, 70, and 500 kDa) imported into MCF10A cells. Counts are respectively normalized by concentration and the mobility of each DTD. f Fluorescence images of nanopore-electroporated cells with FITC-BSA (green). Cell nuclei are stained by Hoechst 33342 (blue). An independent duplicate experiment has verified the similar heterogeneity across cell types in FITC-BSA measurements by flow cytometry. Scale bar, 10 μm. g–i Uniform manifold approximation and projection (UMAP) of cells. The color indicates the cell types (purple: PC-3; blue: MDA-MB-231; green: MCF7; red: MCF10A) (g) and the applied voltages (red: 0 V; blue: 40 V) of nanopore-electroporation (h), and centered log ratios of 4 kDa DTD imported into cells by nanopore-electroporation (i). j Coefficient of correlation between centered log ratio of DTD and the expression of individual genes (Correlation) plotted against the log fold-change of the gene expression between MCF7 and MDA-MB-231 (Cell type). Red points are genes with the log fold-change in average expression is >2.5 or <−2.5. k, l Gene set enrichment analysis (GSEA) showing enriched pathways with genes ordered by correlation and cell type shown in j. The P values (p) are indicated in the graph (b: two-tailed Student’s t-test; c: Tukey’s t-test). Source data are provided as a Source Data file.

