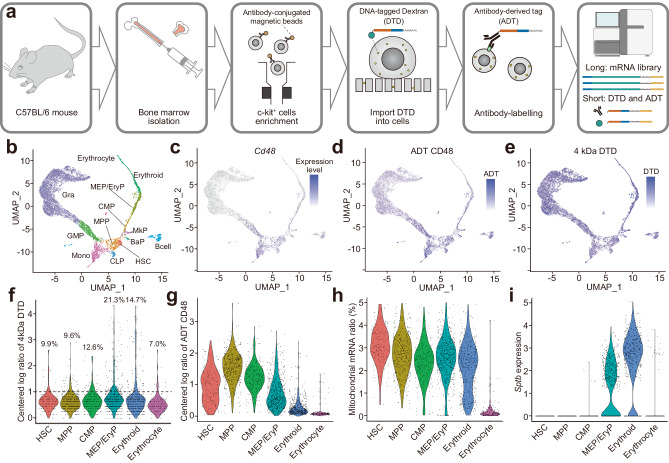
Fig. 2. ELASTomics analysis of mouse hematopoietic stem/progenitor cell (mHSPCs).
a Schematic image of ELASTomics with CITE-seq for mHSPCs. c-kit+ bone marrow (BM) cells were isolated from a C57BL/6 J mouse femur using antibody-conjugated magnetic beads. After DTDs were imported into the c-kit+ BM cells by nanopore-electroporation, the cells were incubated with antibodies conjugated with antibody-derived tag (ADT). The DTDs, ADTs, and mRNA expression were measured by scRNA-seq. b–e UMAP of mHSPCs. The color and color gradient indicates the identified cell types (Gra: granulocyte n = 5786; GMP: granulocyte-macrophage progenitor n = 857; Mono: monocyte n = 730; CLP: common lymphoid progenitor n = 113; MPP: multipotential progenitors n = 394; HSC: hematopoietic stem cell n = 131; MkP: megakaryocyte progenitors n = 126; BaP: basophil progenitors n = 69; CMP: common myeloid progenitor n = 206; EryP/MEP, erythroid progenitors / megakaryocyte-erythrocyte progenitors n = 573; Erythroid n = 463; Erythrocyte n = 115; Bcell n = 356; other n = 92) (b), Cd48 gene expression (c), centered log ratios of Cd48 ADT (d), and centered log ratio of 4 kDa DTD (e), respectively. f–i Comparison of the erythroid lineage cells (HSC, MPP, CMP, MEP/EryP, erythroid, and erythrocyte) with centered log ratios of 4 kDa DTD f, centered log ratios of Cd48 ADT (g), percent fractions of mitochondrial mRNA (h), and gene expressions of Sptb (i), respectively. f The percentage indicates the ratio of cells higher than 1 of the centered log ratio of the 4 kDa DTD.

