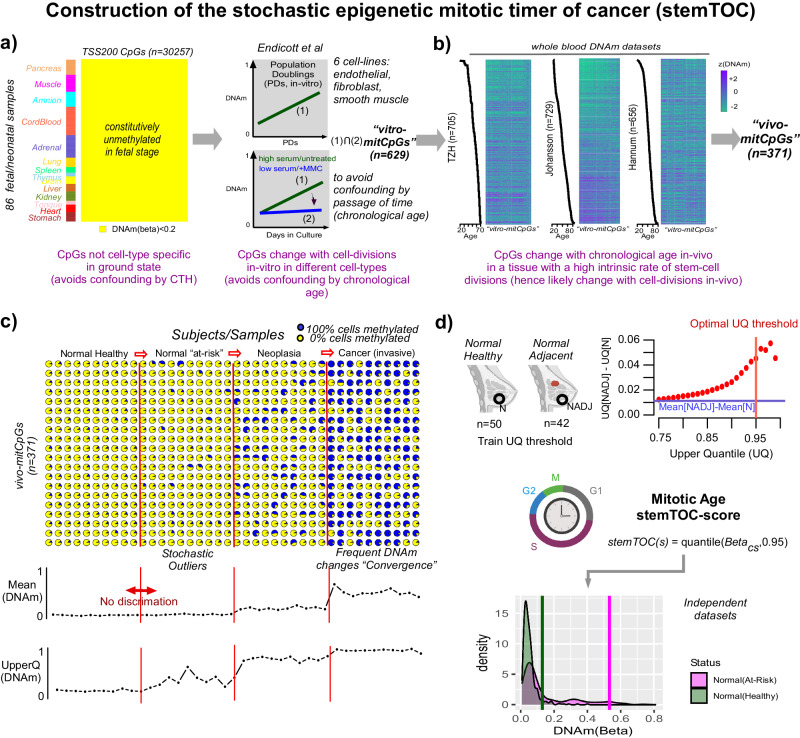
Fig. 1. Construction of stemTOC and estimation of mitotic age.
a We first identify CpGs (n = 30,257) mapping to within 200 bp upstream of the TSS of genes that are unmethylated (defined by DNAm beta value < 0.2) across 86 fetal-tissue samples from 13 different fetal-tissues (including neonatal cord blood). These are then filtered further by the requirements that they display hypermethylation as a function of population doublings (PDs) in 6 cell lines representing fibroblasts, endothelial, smooth muscle, and epithelial cell types. To avoid confounding by chronological age, we also demand that they don’t display such hypermethylation when cell lines are deprived of growth-promoting serum or when treated with mitomycin (MMC, a cell-cycle inhibitor), resulting in 629 “vitro-mitCpGs”. b To exclude cell-culture effects, CpGs displaying significant hypermethylation with chronological age, as assessed in 3 separate whole-blood cohorts and after adjusting for variations in 12 immune-cell type fractions, are selected. In the heatmaps, rows label samples, ordered by increasing age. Columns label CpGs ordered according to hierarchical clustering. c Simulation of DNAm changes at 20 CpGs during carcinogenic transformation (a total of 40 independent samples, 10 from each disease stage). Initially, DNAm changes are inherently stochastic, and average DNAm over the CpGs may not discriminate normal healthy from normal “at-risk” tissue. Taking an upper 95% quantile of the CpG’s DNAm values can discriminate normal from normal at-risk. d Top: Scatterplot depicts the difference in upper quantiles (y-axis) over the 371 vivo-mitCpGs between 42 normal samples adjacent to breast cancer (NADJ, “normal at-risk”) and 50 age-matched healthy samples (N, “normal healthy”), against the upper quantile threshold (x-axis). Horizontal blue line indicates the difference in mean DNAm over the 371 CpGs between NADJ and N tissue. Vertical red line marks the upper-quantile threshold maximizing difference without compromising variability. A relative mitotic-age score (stemTOC) is obtained for any sample, by taking the 95% upper quantile (UQ) over the 371 DNAm beta-values corresponding to these vivo-mitCpGs. Bottom density plots display the distribution of the 371 DNAm values for one hypothetical normal healthy and one hypothetical normal at-risk sample. Vertical lines indicate the stemTOC-scores (95% upper quantiles defined over the 371 CpGs). Generated with Biorender.com.

