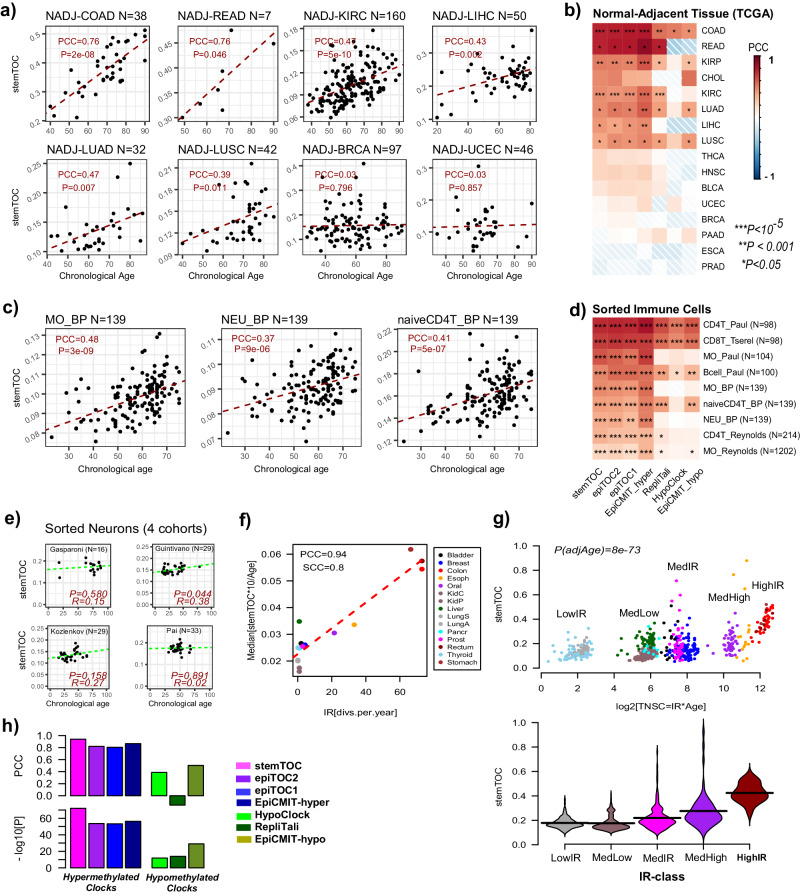
Fig. 2. Validation and benchmarking of stemTOC.
a For selected normal-adjacent tissue-types, scatterplots of stemTOC’s mitotic age (y-axis) vs chronological age (x-axis). Number of normal-adjacent samples is given above each plot. The Pearson Correlation Coefficient (PCC) and two-tailed P-value from a linear regression are given. Normal-adjacent tissue-types in TCGA are labeled by the corresponding cancer type. b Heatmap of PCC values between mitotic and chronological age for 7 mitotic clocks and across all normal-adjacent tissue-types from the TCGA. Two-tailed P-values are from the linear regression test. Number of normal-adjacent samples for tissue-types not shown in (a) are: CHOL(n = 9), KIRP(n = 45), THCA(n = 56), HNSC(n = 50), BLCA(n = 21), PAAD(n = 10), PRAD(n = 50), ESCA(n = 16). c As (a), but for three sorted immune-cell populations as profiled by BLUEPRINT. d As (b) but for all sorted immune-cell populations. Sorted immune-cell samples labeled by cell-type and study it derives from. BP = BLUEPRINT. e As (a) but for sorted neurons from 4 different cohorts. In each panel we give the R-value (same as PCC) and corresponding correlation test P-value. f Scatterplot of a normal tissue’s relative intrinsic rate (RIR) estimated from taking the median of stemTOC’s mitotic age divided by chronological age and multiplied by 10 (y-axis), against the Vogelstein–Tomasetti intrinsic annual rate of stem-cell division (IR) (x-axis), using the normal-adjacent tissues with such estimates. The Pearson and Spearman Correlation Coefficients (PCC & SCC) are given. g Top: Scatterplot of a normal sample’s mitotic age (estimated with stemTOC) vs the estimated total number of stem-cell divisions (TNSC = IR * Age) expressed in a log2-basis, to better highlight the differences between the low and medium turnover tissues. Two-tailed P-value is from a multivariate linear regression including age as a covariate. Bottom: Violin plot representation of middle panel, with normal-adjacent tissue samples grouped into 5 IR-classes, as shown. Low: Thyroid + Lung, MedLow = Liver + Pancreas + Kidney, Med = Prostate + Breast + Bladder, MedHigh = Esophagus + Oral, High = Colon + Rectum + Stomach. h Barplots compare the PCC and significance level attained by stemTOC shown in (g) to the corresponding values for 6 other mitotic clocks. Mitotic clocks based on CpGs that gain/lose methylation with cell division (hypermethylated/hypomethylated) are indicated. RepliTali results are for the probes restricted to 450k beadarrays.

