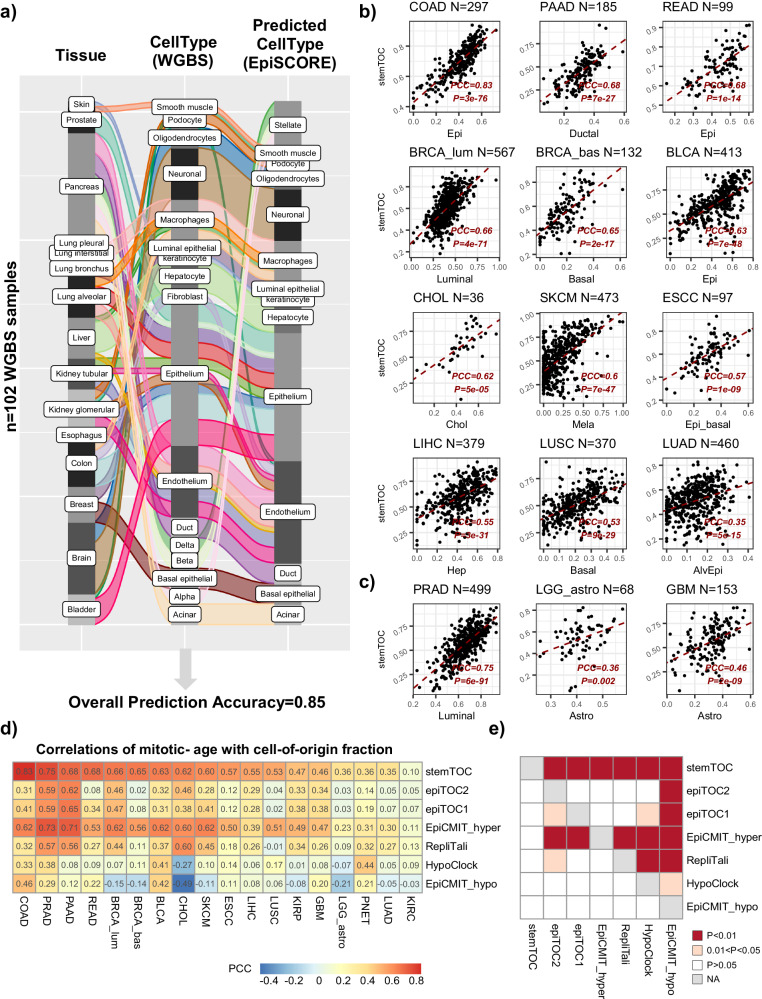
Fig. 3. Correlation of stemTOC with tumor cell-of-origin fraction.
a Alluvial plot displaying the validation of EpiSCORE on sorted WGBS samples from Loyfer et al. DNAm atlas. The left and middle bars label the tissue-type and cell type of the WGBS sample from Loyfer et al. DNAm atlas. Right bar labels the predicted cell type using EpiSCORE. Overall prediction accuracy is given below. b Scatterplot of stemTOC’s relative mitotic age estimate (y-axis) vs. the presumed cell-of-origin fraction derived with EpiSCORE (x-axis) for selected TCGA cancer types. The number of tumor samples is indicated above the plot. For each panel, we provide the Pearson Correlation Coefficient (PCC) and P-value from a linear regression. Of note, in each panel, we are displaying the cell type that displayed the strongest correlation with mitotic age and this coincides with the presumed cell-of-origin. c As (b), but for 3 tumor types where the tumor cell-of-origin is less well established or controversial. d Heatmap of Pearson correlations for all 7 mitotic clocks and across all 18 cancer types. COAD(n = 297), PRAD(n = 499), PAAD(n = 185), READ(n = 99), BRCA_lum(n = 567), BRCA_bas(n = 132), BLCA(n = 413), CHOL(n = 36), SKCM(n = 473), ESCC(n = 97), LIHC(n = 379), LUSC(n = 370), KIRP(n = 276), GBM(n = 153), LGG_astro(n = 68), PNET(n = 45), LUAD(n = 460), KIRC(n = 320). e Heatmap displaying one-tailed paired Wilcoxon rank sum test P-values, comparing clocks to each other, in how well their mitotic age correlates with the tumor cell-of-origin fraction. Each row indicates how well the corresponding clock’s mitotic age estimate performs in relation to the clock specified by the column. The paired Wilcoxon test is performed over the 18 cancer types. RepliTali results are for the probes restricted to 450k beadarrays.

