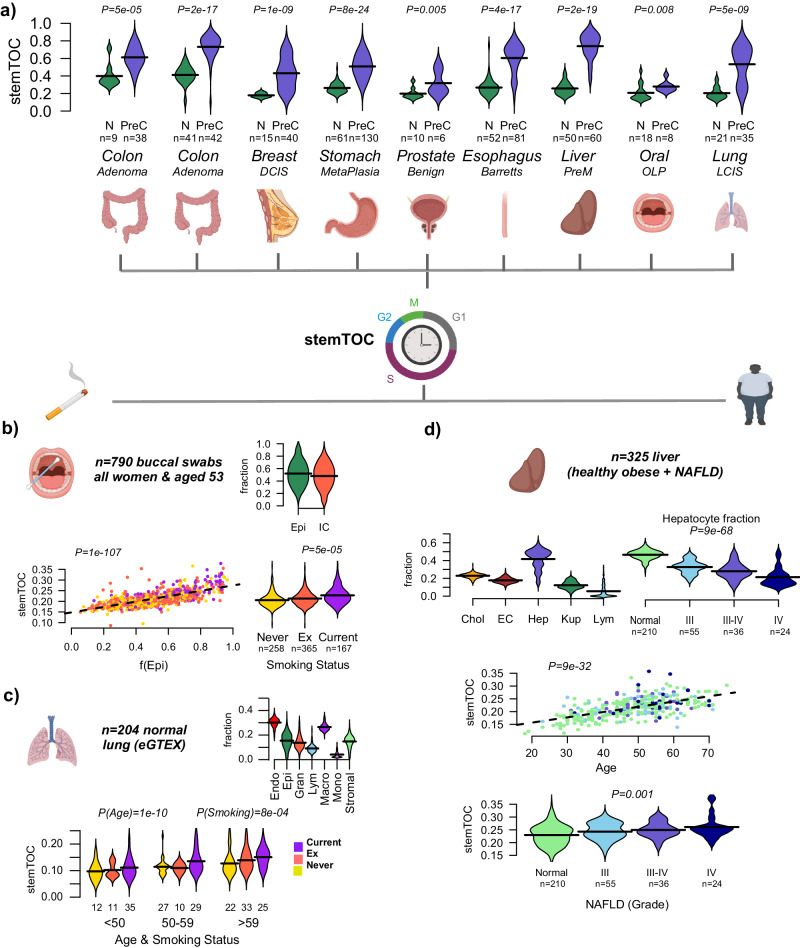
Fig. 4. stemTOC correlates with cancer risk and cancer-risk factors.
a Violins display the distribution of stemTOC’s mitotic age for normal tissue (N) and age-matched precancerous (PreC) samples for 9 different DNAm datasets. Number of samples in each category is displayed below x-axis, as well as the tissue-type and the nature of the precancerous sample. DCIS ductal carcinoma in situ, PreM premalignant, OLP oral lichen planus, LCIS lung carcinoma in situ. P-value derives from a one-tailed Wilcoxon rank sum test. b Top: Violin plots depicting the estimated epithelial and immune cell fraction in 790 buccal swabs from women all aged-53 at sample draw. Bottom left: Scatterplot of stemTOC (y-axis) against estimated squamous epithelial fraction (x-axis) for the same 790 buccal swabs. Samples are colored by their lifelong smoking habit (current, ex-smoker, and never-smoker). Two-tailed P-value is from a multivariate linear regression including epithelial fraction and smoking status. Bottom right: Violin plots display stemTOC versus smoking status. Two-tailed P-value is from a multivariate linear regression including smoking status and squamous epithelial fraction. c Top: Violins display the estimated cell-type fraction for 7 lung cell types (Endo endothelial, Epi epithelial, Gran granulocyte, Lym lymphocyte, Macro macrophage, Mono monocyte, Stromal) in 204 normal lung samples from eGTEX. Bottom: Violin plots display stemTOC versus chronological age and smoking status in the same 204 normal lung-tissue samples. Number of samples in each smoking category and age-group is shown below each box. Violin colors label smoking status as in (b). Two-tailed P-values for age and smoking status are derived from a multivariate linear regression that included age, smoking, and lung epithelial fraction. d Top left: Violins of estimated cell-type fractions for 5 cell types (Hep hepatocytes, Chol cholangiocytes, EC endothelial cells, Kup Kupffer cells, Lym lymphocytes) in 325 liver samples. Top right: Violins of the hepatocyte fraction against NAFLD disease stage. Two-tailed P-value is from a linear regression. Middle: Scatterplot of stemTOC (y-axis) against chronological age (x-axis) for the same 325 liver samples, with colors labeling the stage of NAFLD, with color label as in the previous panel. Bottom: Violin plots display mitotic age against NAFLD stage. Two-tailed P-value for disease stage derives from a multivariate linear regression that included age and hepatocyte fraction. Generated with Biorender.com.

