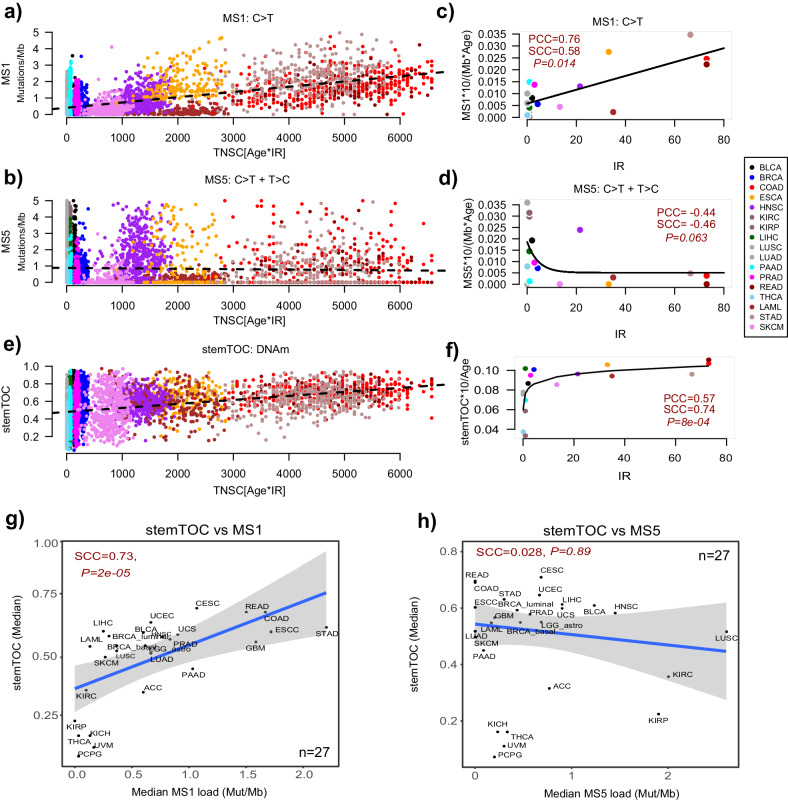
Fig. 5. Relation of stemTOC with somatic mutational MS1 and MS5 signatures.
a Scatterplot of MS1-signature load (Mutations/Mb, y-axis) against the estimated total number of stem-cell divisions (Age*intrinsic annual rate of stem-cell division of the corresponding normal tissue (IR), x-axis) for >7000 cancer samples from 17 TCGA cancer types. Only cancer types with an IR estimate in normal tissue were used. Two-tailed P-values derive from a multivariate linear regression including age as a covariate. b As (a) but for somatic mutational signature MS5. c Median value of age-adjusted MS1-signature load (multiplied by 10 to reflect change over a decade) for each cancer type vs the annual intrinsic rate of stem-cell division of the corresponding normal tissue-type. Both Pearson (PCC) and Spearman (SCC) correlation coefficients are given. Two-tailed P-value tests for significance of SCC. Fitted line is that of a linear regression model as this outperformed non-linear models. d As (c) but for MS5. Best fit was for a non-linear decreasing function. e As (a), but for stemTOC’s mitotic age. f As (c), but for stemTOC, adjusted for chronological age and multiplied by 10 to reflect DNAm change over a decade. Best fit was for a non-linear increasing function displaying a saturation effect, as shown. g Scatterplot of the median stemTOC value of each TCGA cancer type (y-axis) vs the median mutational load (mutations per Mb) of that cancer type, for MS1. Spearman’s correlation coefficient and P-value are given. Regression line with standard error interval is shown. h As (g) but for MS5.

