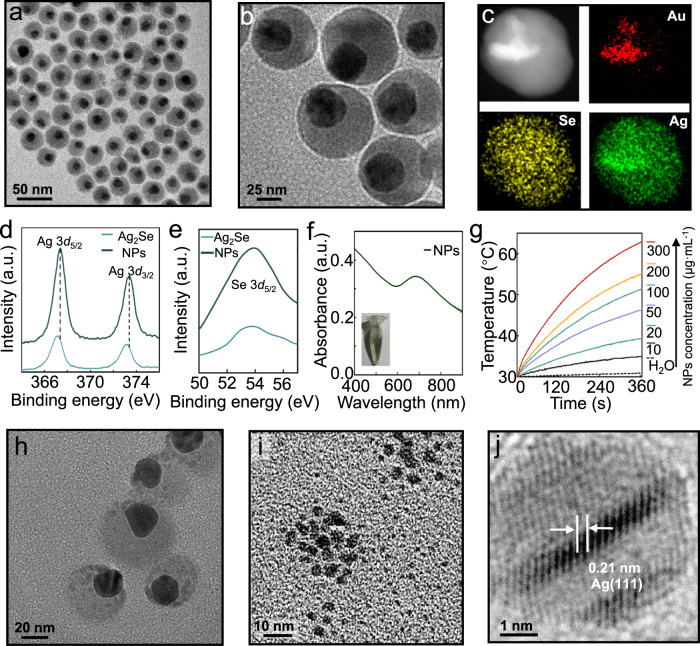
Fig. 3. Characterization of the Au@Ag2Se-FA NPs.
a TEM, and (b), high-resolution (HR) TEM images of Au@Ag2Se-FA NPs, showing an asymmetric core-shell structure where the dark circular core and the half-transparent shell are attributed to Au and Ag2Se, respectively. c Elemental mapping of an individual Au@Ag2Se-FA NP, where the signals of Au, Ag, and Se are in red, green, and blue, respectively. d Ag 3d, and (e), Se 3d X-ray photoelectron spectra of Au@Ag2Se-FA NPs (NPs), with the spectra of Ag2Se NPs as a comparison: the peaks located at 367.4 and 373.4 eV in panel d are attributed to Ag+, and the peak centered at 53.8 eV in panel e is attributed to Se2– of Au@Ag2Se-FA. f UV–Vis–NIR absorption spectrum of Au@Ag2Se-FA dispersion (100 μg mL–1), where the inset shows its digital photo. g Concentration-dependent temperature rise of Au@Ag2Se-FA dispersion at various concentrations (0–300 μg mL–1) upon NIR irradiation (808 nm, 1.2 W cm–2). h TEM image of Au@Ag2Se-FA after irradiation, showing dotted-like motifs formed in the Ag2Se shell. i TEM image of the small NPs (<5 nm) in the supernatant of irradiated Au@Ag2Se-FA dispersion. j HRTEM image of a single small NP in (i), revealing its crystallization and a lattice spacing (∼0.21 nm) matching that of Ag(111).

