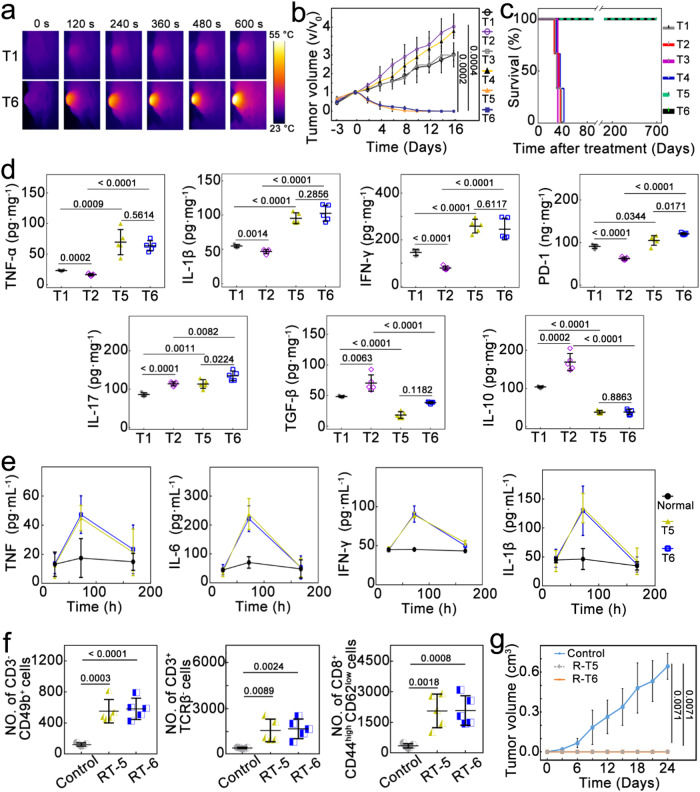
Fig. 5. Therapeutic effect of Au@Ag2Se-FA in vivo.
a In vivo IRT images of 4T1 tumor-bearing mice in the T1 and T6 groups upon 10 min of NIR irradiation. b Tumor growth rate of different groups (n = 5 mice per group), three of which were i.t. injected with E. coli (T2, T4, and T6). All groups were then treated, respectively, by (i) i.v. injection of PBS plus NIR irradiation (T1 and T2), (ii) i.v. injection of Au@Ag2Se-FA only (T3 and T4), and (iii) i.v. injection of Au@Ag2Se-FA plus irradiation (T5 and T6). c Survival curves after the various treatments (n = 5 mice per group), where all mice in T5 and T6 survive over 700 days without tumor reoccurrence. d Intratumoral expression level of TNF-α, IL-1β, IL-17, IFN-γ, PD-1, IL-10, and TGF-β upon the various treatments (n = 5 mice per group). e Serum cytokine concentration of TNF, IL-6, IFN-γ, and IL-1β at the selected time points for T5 and T6 (n = 3 mice per group), all quickly increasing with time, reaching the peak at 72 h, then declining to the baseline level as that of healthy mice without any treatment (Normal) at Day 7. f Flow cytometric analysis for the number of NK cells (CD3-, CD49b+), γδ T cells (CD3+, TCRβ-), and memory T cells (CD8+, CD44high, CD62Llow) per 100,000 cells in blood or spleen of the R-T5 and R-T6 groups, with the results from the untreated 4T1 tumor-bearing mice as Control (n = 5 mice per group). g Tumor growth curves after subcutaneous re-challenge (n = 4 mice per group). Data are presented as mean ± standard deviation. One-way ANOVA with Tukey’s post hoc test (d, f) or two-tailed Student’s t-test (b, g). P < 0.05 is considered to be statistically significant.

