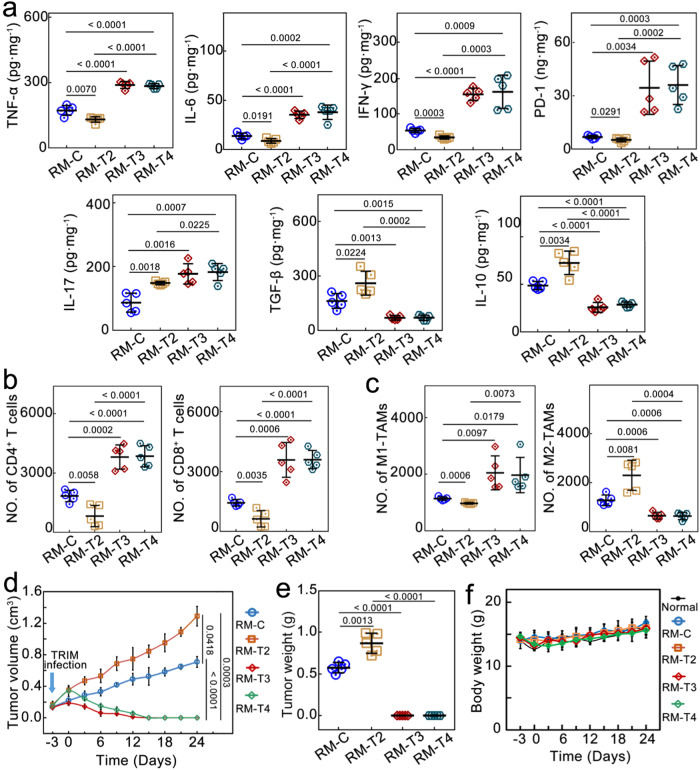
Fig. 7. In vivo therapeutic effect on the RM-1 cancer model.
a Intratumoral expression level of TNF-α, IL-6, IL-17, IFN-γ, PD-1, IL-10, and TGF-β upon the various treatments (n = 5 mice per group). b Flow cytometric analysis for the numbers of the helper (CD3+, CD4+) and cytotoxic (CD3+, CD8+) T cells, and (c) M1-like (CD86+, CD11b+) and M2-like (CD206+, F4/80+) TAMs per 100,000 cells from the tumors three days after the treatments (n = 5 mice per group). d Average tumor growth curves, (e), mean tumor weight, and (f), body weight of mice in different groups (n = 5 mice per group). Data are presented as mean ± standard deviation. One-way ANOVA with Tukey’s post hoc test (a–c, e) or two-tailed Student’s t-test (d). P < 0.05 is considered to be statistically significant.

