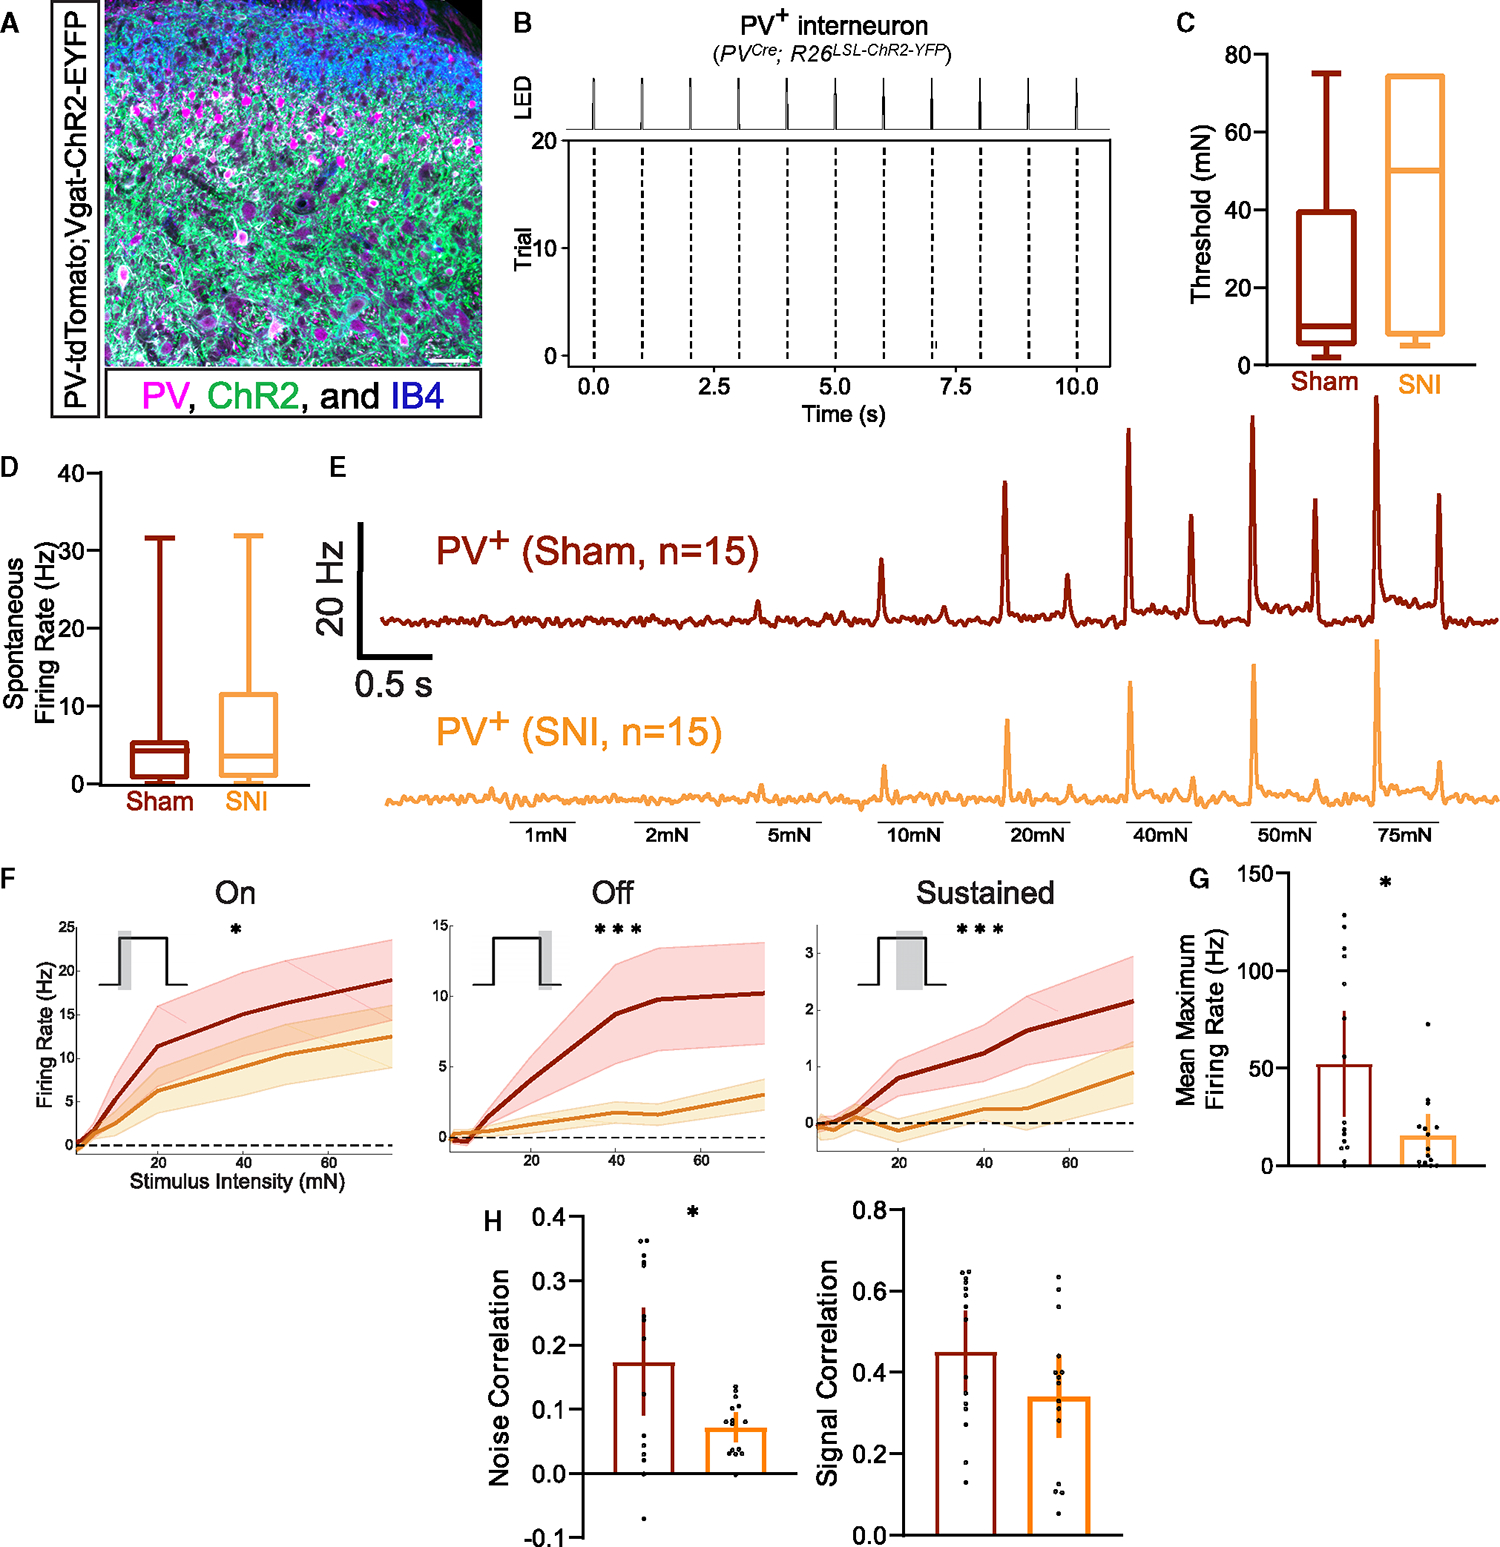
Figure 4. Dorsal horn PV+ interneuron activity is decreased in mice following SNI.

(A) Transverse spinal cord section showing PV+ interneurons in comparison to all Vgat+ cells (PV-tdTomato; Vgat-ChR2-EYFP mouse). PV+ neurons, magenta; Vgat-ChR2+ neurons, green; IB4 binding, blue (labels lamina IIi). Scale bar: 50 μm.
(B) Raster plot of light-evoked spikes in a PV+ interneuron (PVCre; R26LSL-ChR2-YFP).
(C) Indentation thresholds across PV+ neurons in sham (N = 3, n = 15) and SNI (N = 3, n = 15) mice.
(D) Spontaneous firing rates of PV+ interneurons in sham (N = 3, n = 15) and SNI (N = 3, n = 15) mice.
(E) Mean baseline-subtracted firing rate PSTHs for sham and SNI PV+ neurons.
(F) Average baseline-subtracted firing rates (±SEM) for PV+ neurons in sham and SNI groups at step indentation on, off, and sustained periods. On: two-way ANOVA (F[1, 240] = 5.602 p = 0.0187). Off: two-way ANOVA (F[1, 240] = 14.59, p = 0.0002). Sustained: two-way ANOVA (F[1, 240] = 11.41, p = 0.0009).
(G) Sham and SNI PV+ interneurons average maximum brush evoked firing rates. Unpaired t test.
(H) Noise (left) and indentation signal (right) correlations between PV+ interneurons and neighboring cells in sham and SNI mice. Unpaired t test. Bars: mean. Error bars: 95% CI. Number of animals/cells (N/n). *p < 0.05, **p < 0.01, ***p < 0.001. See Table S1 for statistical details.
