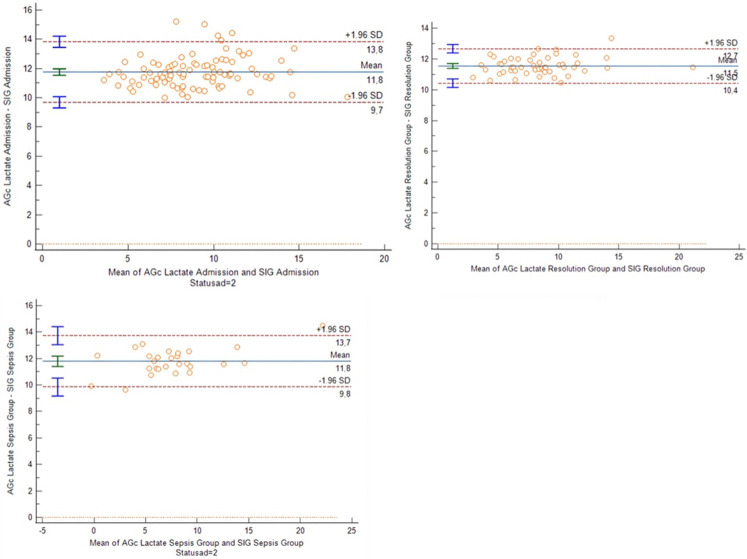
Figure 3.
Bland-Altman plots of [AGcl] and [SIG] for patients during admission and on sepsis deterioration or remission. Note the mean difference of the two methods being around 12 mEq/l and similar in all 3 groups. The 95% limits of agreement are also almost identical in all patient groups. Visually the data appears to have a rather normal distribution, which was statistically confirmed. The variance of the data also was constant over the measurement range.

