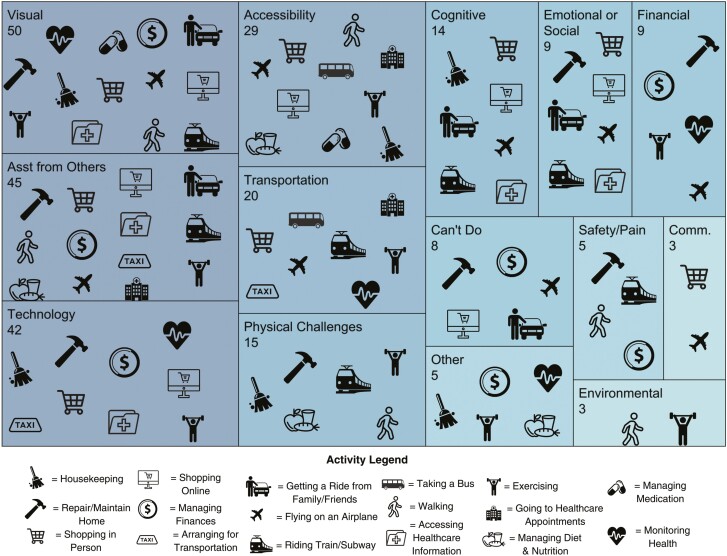
Figure 2.
Treemap displaying proportion of challenge codes (n = 257) reported across 17 activities. Data are presented in nested rectangles that each represent distinct challenge codes, proportional in size to the number of times the challenge was reported across activities. Within each rectangle (1) the frequency of each challenge type is listed below the name of each challenge and (2) the presence of an activity icon indicates the challenge type was reported for that activity (challenge codes reported fewer than three times excluded from figure).

