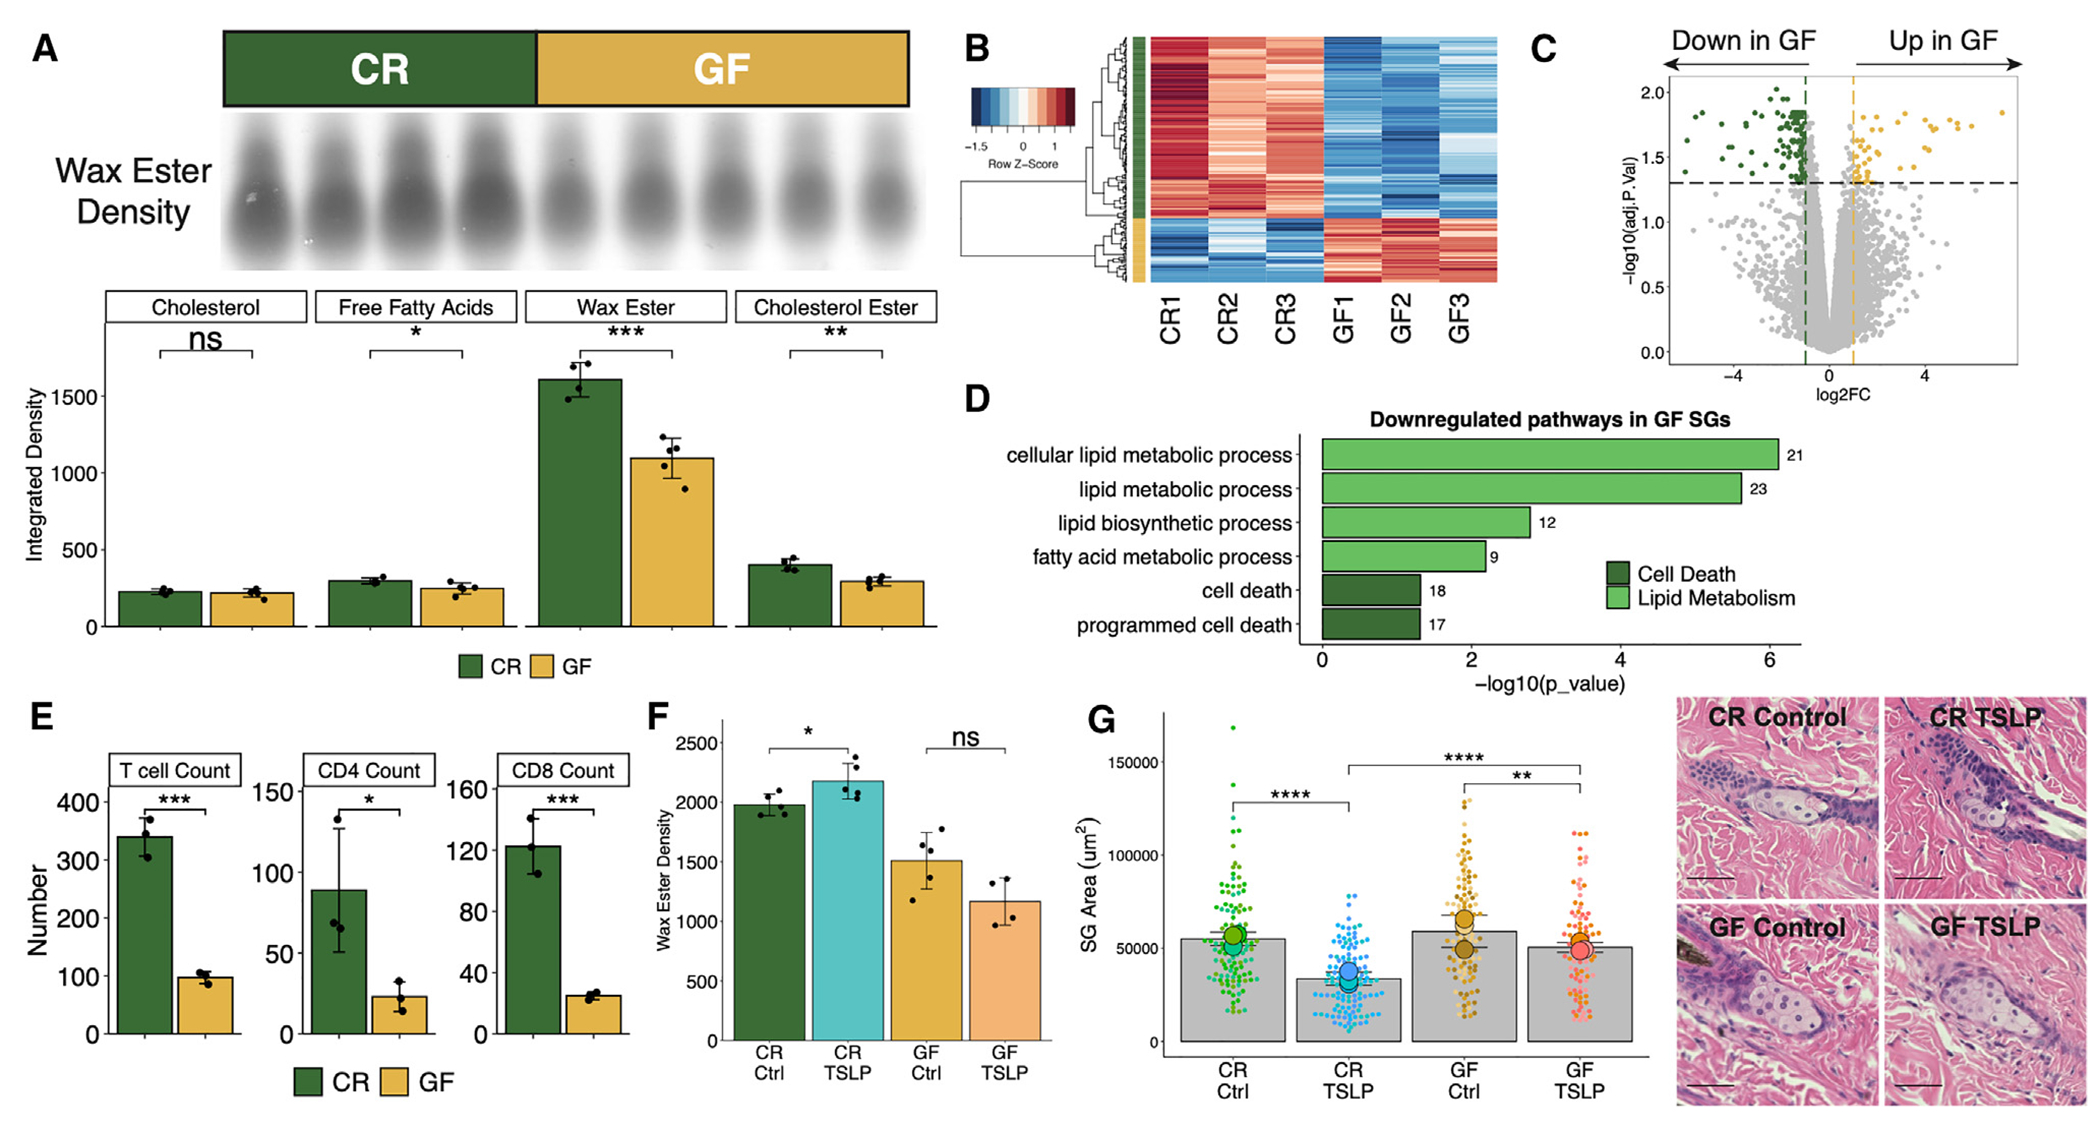
Figure 1. GF mice display a defective immune-sebum circuit.

(A) Wax ester intensity and hair sebum lipid quantification by thin-layer chromatography (TLC) (n = 4 or 5 mice/group).
(B) Heatmap of DEGs quantitated from bulk mRNA-seq of LCM-isolated GF or CR mouse SGs (n = 3 mice/group).
(C) Volcano plot highlighting SG genes upregulated (45 genes) and downregulated (127 genes) in GF mice.
(D) Selected GO terms downregulated in GF SGs. Number of genes within the dataset within each term is listed beside the bar.
(E) Number of skin T cells (n = 3 mice/group).
(F and G) CR or GF mice treated intravenously with one dose of 5 × 10¹⁰ genome copies of control- or TSLP-adeno-associated virus (AAV) for 14 days (n = 4 or 5 mice/group).
(F) TLC quantification of wax ester from hair (n = 4 or 5 mice/group).
(G) SG area with representative H&E images (scale bars, 100 μm; n = 3 mice/group, n = 27–53 SGs/mouse).
Sequencing experiments were performed once. All other experiments were performed 2–5 times. ns, not significant, *p < 0.05, **p < 0.01, ***p < 0.001, and ****p < 0.0001 by Student’s t test. Data are shown as mean ± SD.
See also Figure S1.
