
Figure 4. GF barrier and metabolic tissue display transgenerational transcriptional dysfunction.
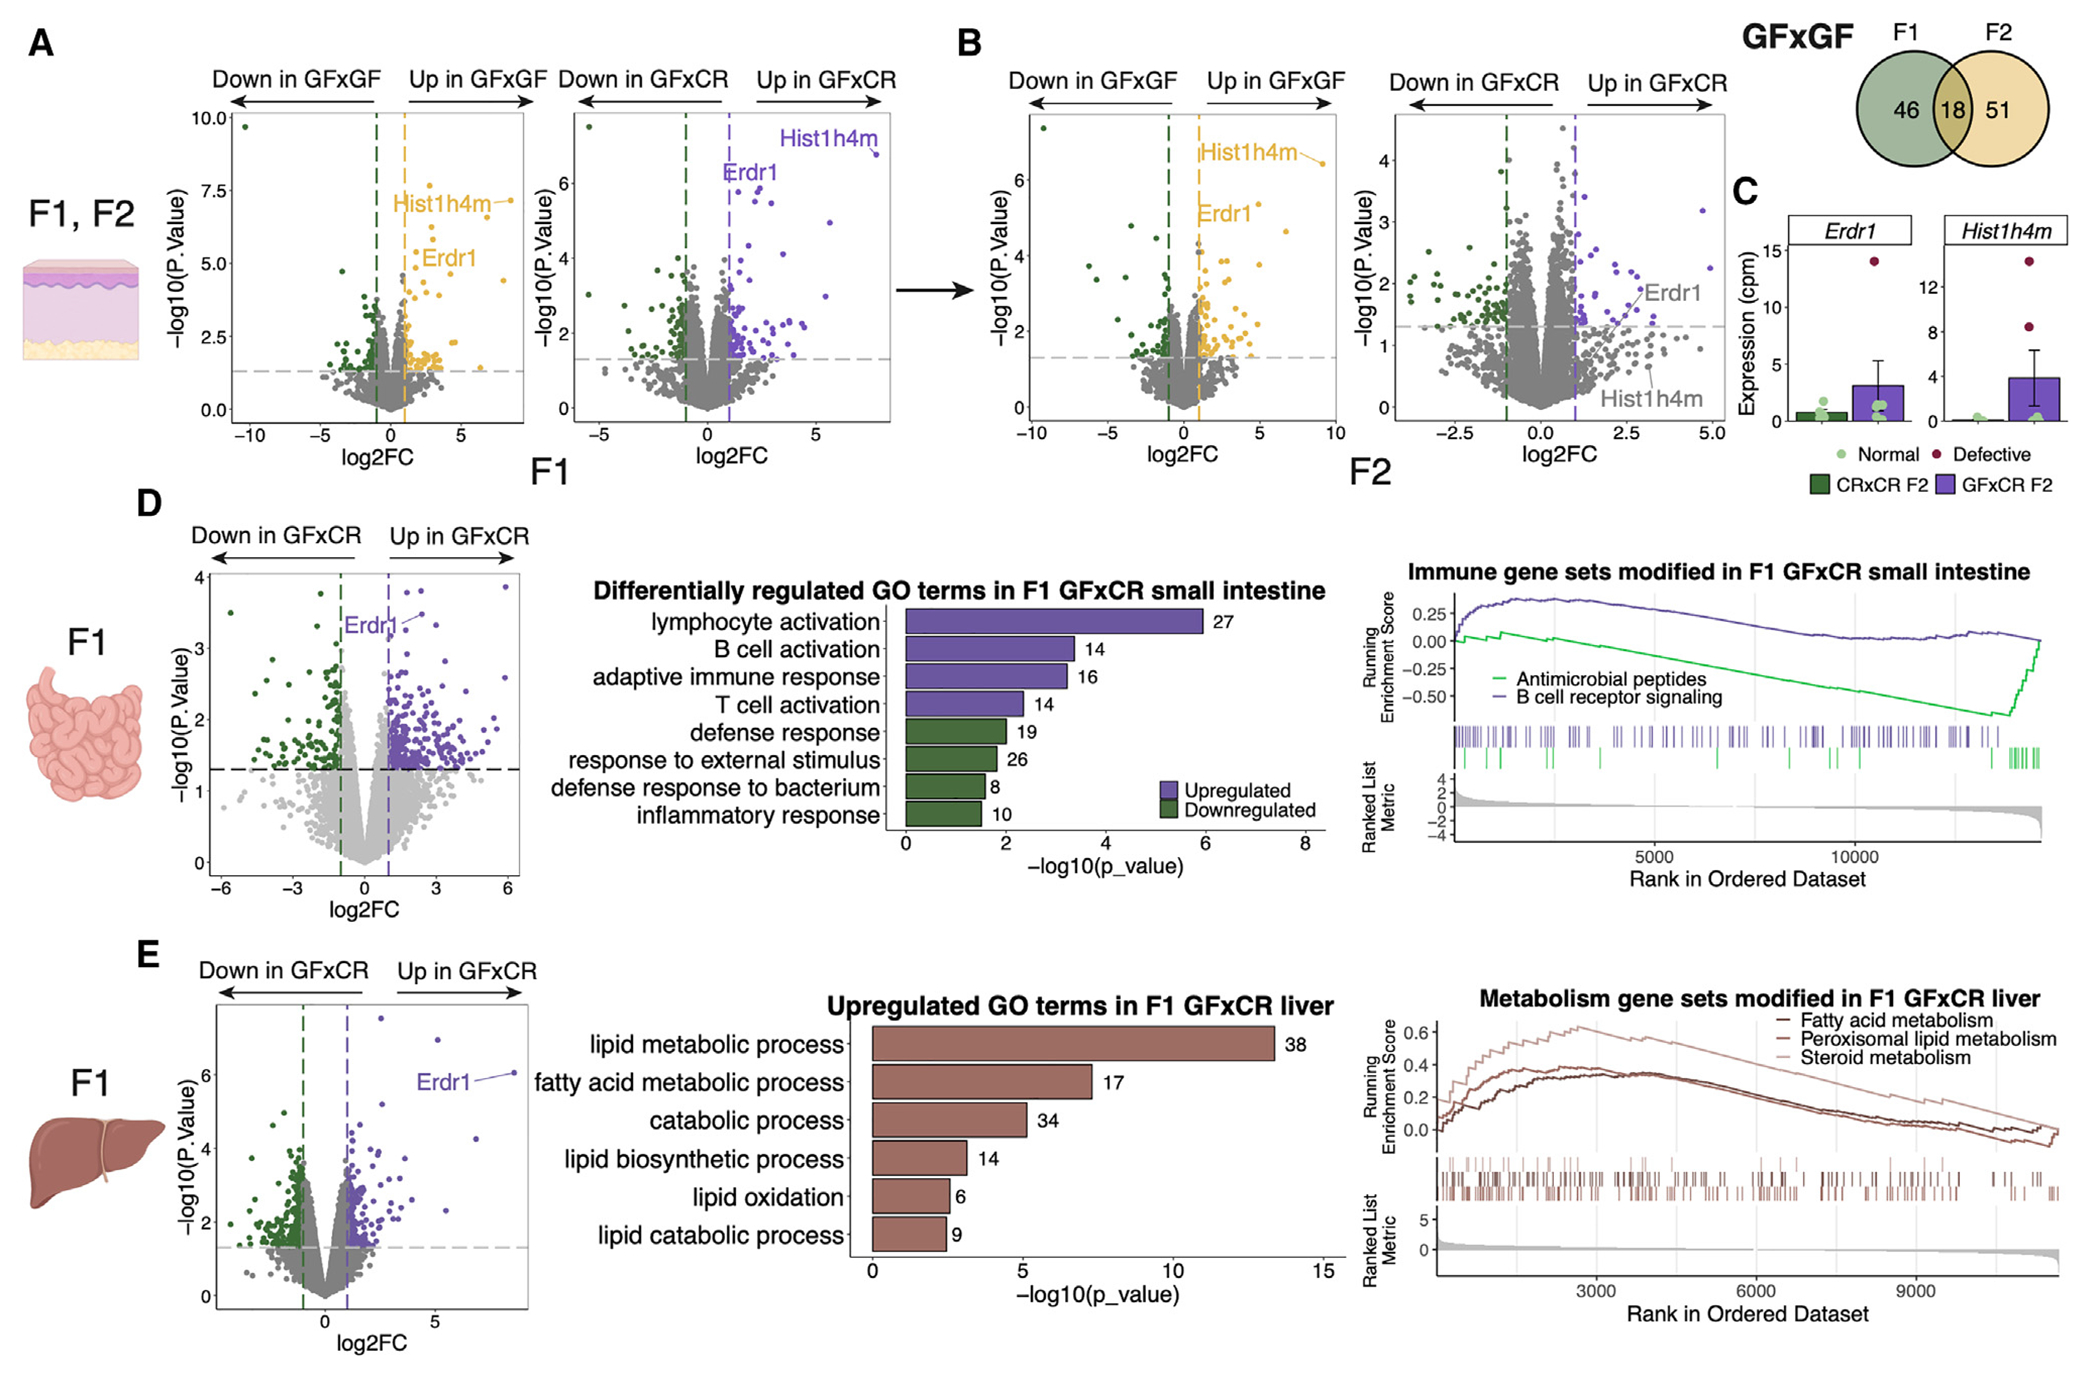
(A–C) Gene expression by RNA-seq of F1 and F2 CR×CR, GF×GF, and GF×CR back skin (n = 3–6 mice/group). Volcano plots representing pairwise group comparisons of DEGs across (A) F1 and (B) F2 generations, highlighting two common genes and a Venn diagram highlighting all common genes between F1 and F2 GF×GF skin. (C) Counts per million of two F1 DEGs with bimodal expression in F2.
(D) Gene expression by RNA-seq of F1 CR×CR and GF×CR small intestine (n = 3 or 4 mice/group) including DEGs, GO terms, and GSEA showing upregulated and downregulated pathways.
(E) Gene expression by RNA-seq of F1 and CR×CR and GF×CR liver tissue (n = 3 or 4 mice/group) including DEGs, GO terms, and GSEA showing upregulated pathways.
The number of genes within the dataset within each GO term is listed beside the bar. Genes in GSEA plot are shown in ranked order by running enrichment scores. Sequencing experiments were performed once. Data in bar plot are shown as mean ± SD.
See also Figure S4.