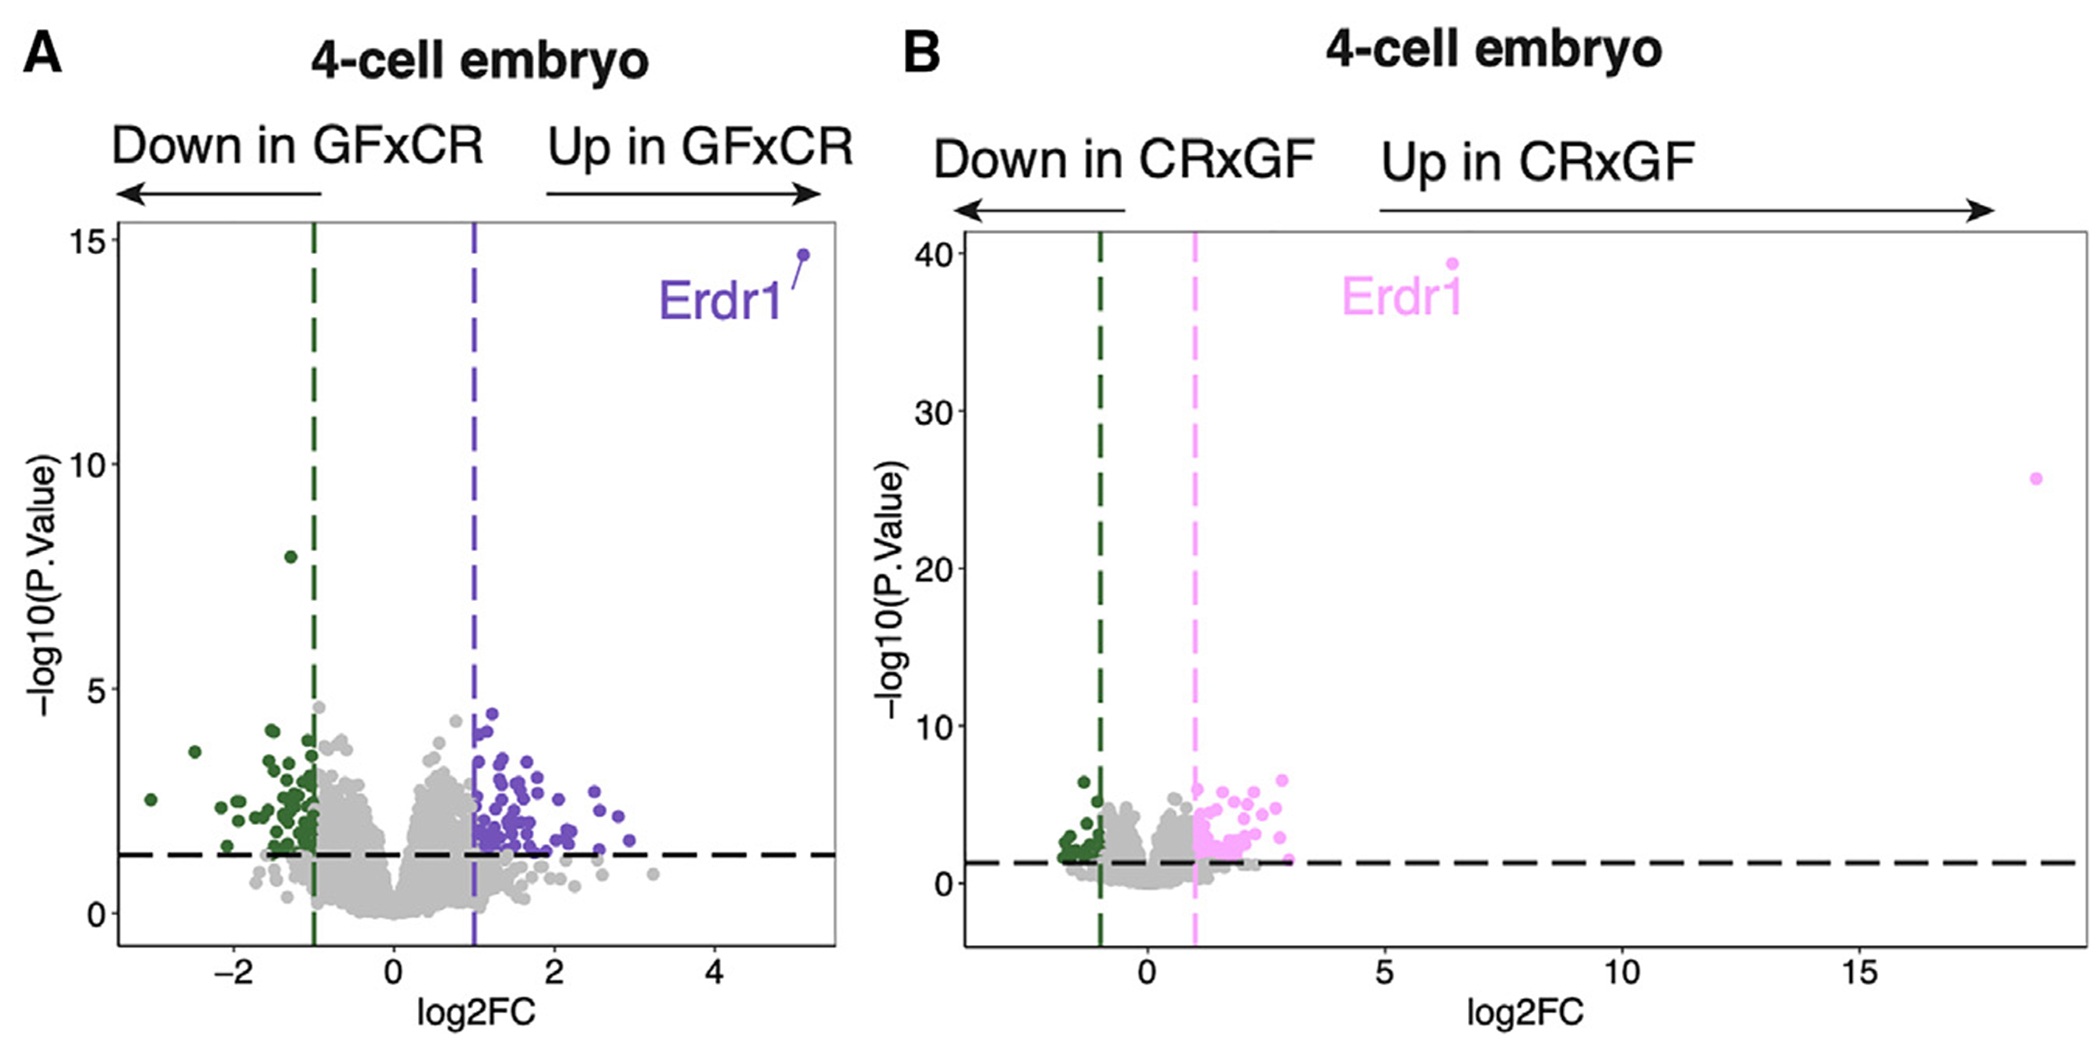
Figure 5. Early embryos from GF mice exhibit a distinct gene expression profile.

Gene expression by RNA-seq of CR×CR vs. GF×CR (A) and CR×CR vs. CR×GF (B) 4-cell embryos (n = 9–25 embryos/group, collected over three biological replicates of IVF). DEGs are defined as log2 fold change >1 or < −1, p < 0.05. Sequencing experiments were performed once.
See also Figure S4.
