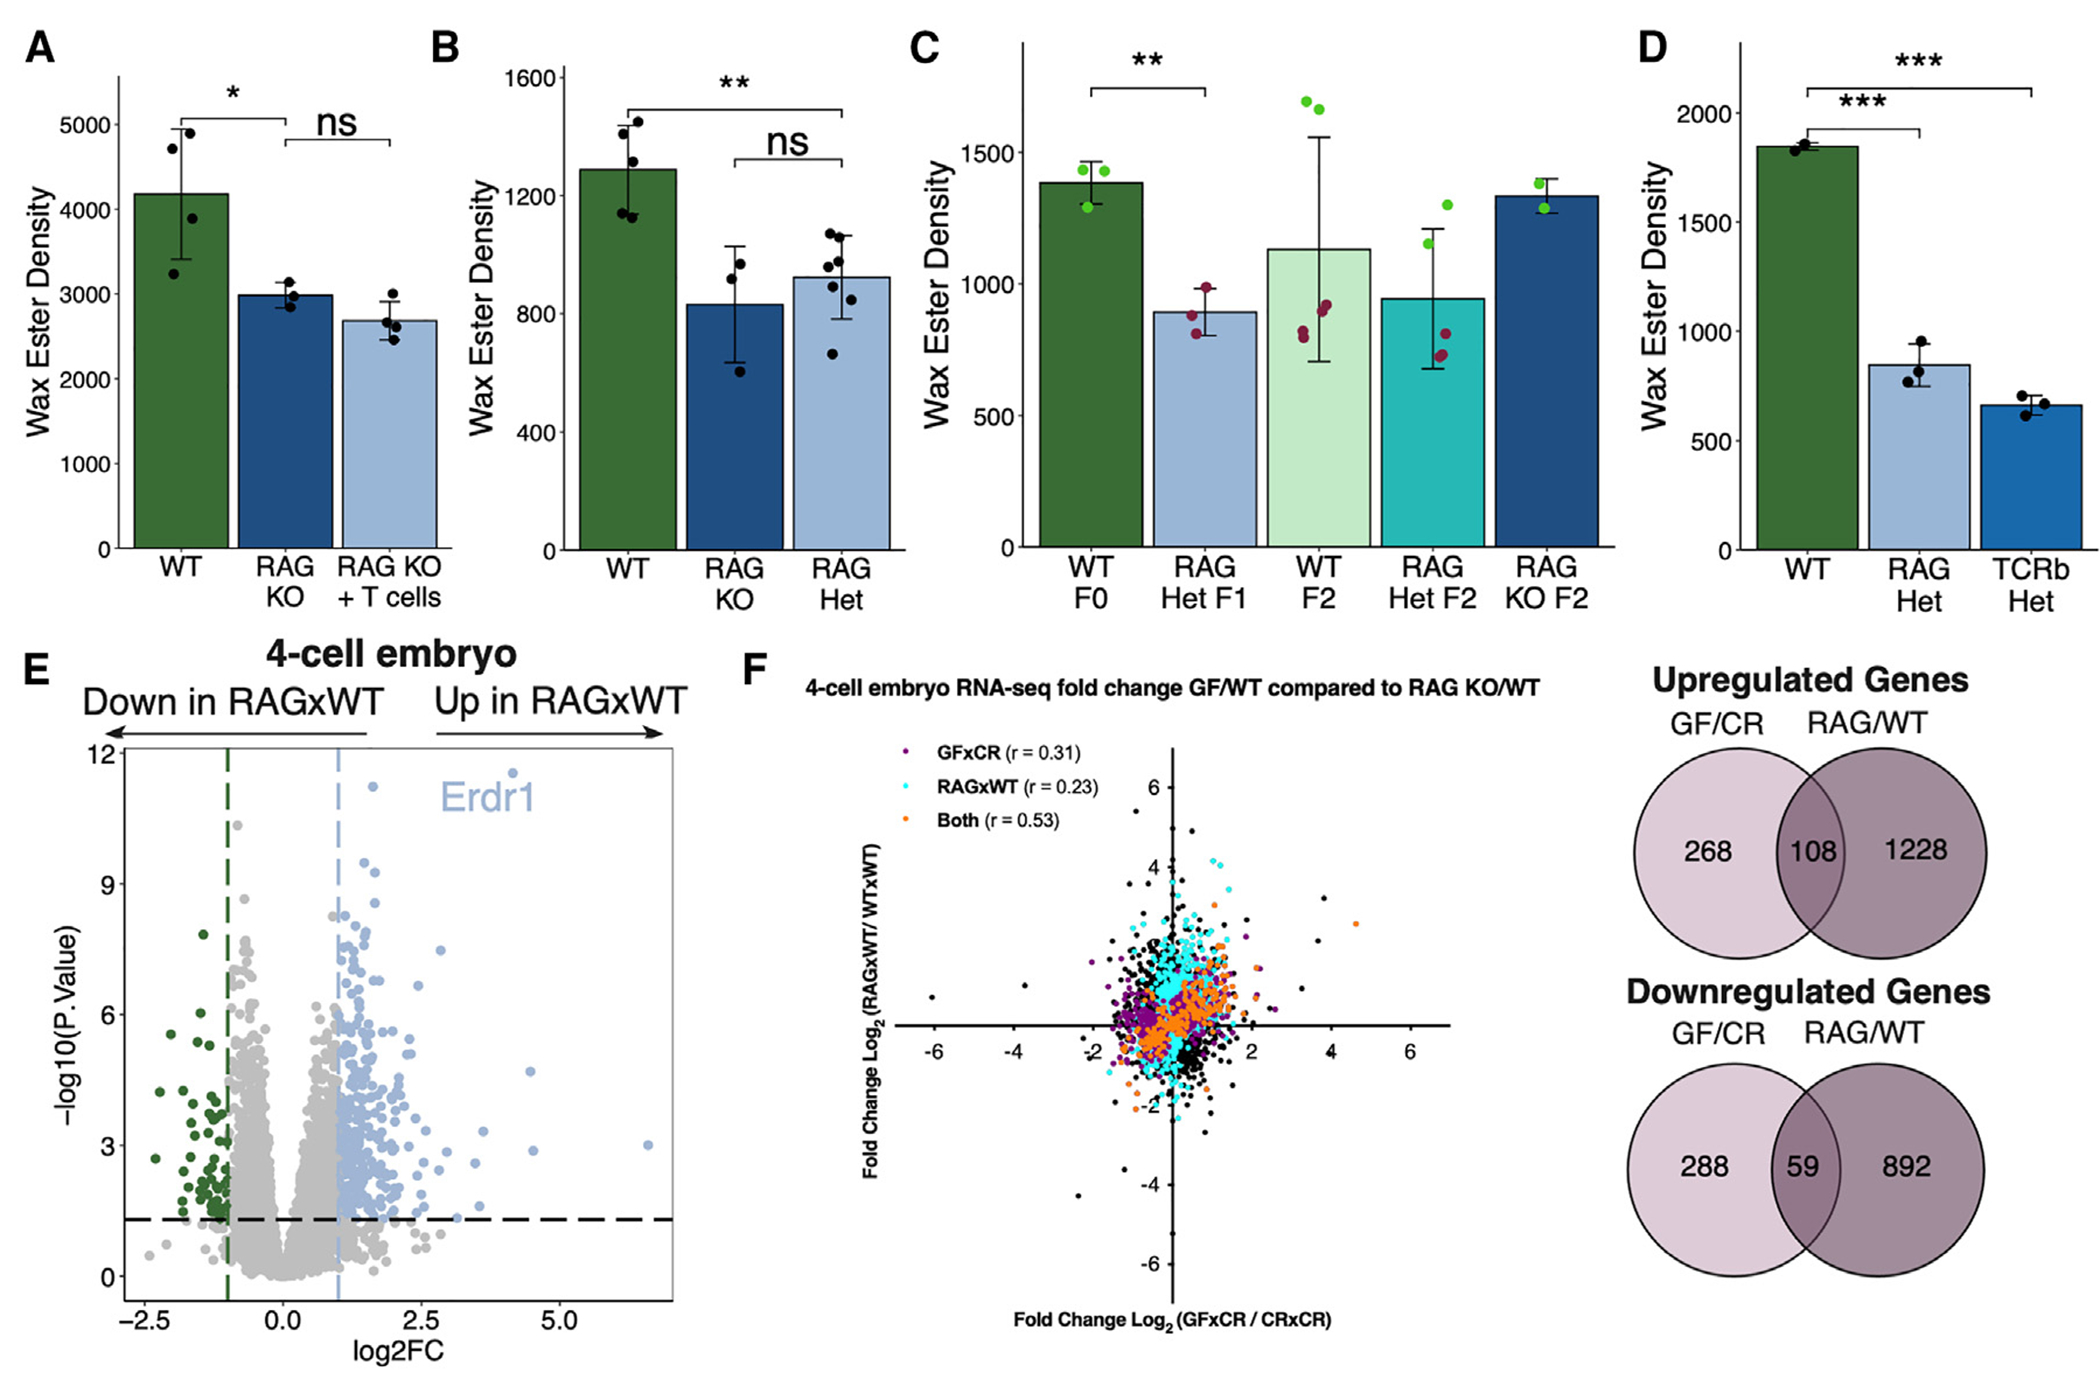
Figure 6. T cell-deficient mice display a sebum secretion defect that is non-genetically transmitted to progeny transgenerationally.

(A–D) TLC quantification of hair wax esters from (A) WT or Rag2−/− mice with or without reconstitution by T cells (n = 3 or 4 mice/group). (B) WT, Rag2−/−, and F1 Rag2+/− mice (n = 3–7 mice/group). (C) WT, F1 Rag2+/−, and F2 WT, Rag2+/−, and Rag2−/− mice (n = 2–6 mice/group). Point colors represent physiologic (green) or defective (red) levels of sebum secretion. (D) F1 WT, Rag2+/−, and TCRβ+/− mice (n = 3 mice/group).
(E) Gene expression by RNA-seq of WT and RAG×WT 4-cell embryos (n = 21 or 25 embryos/group, collected over three biological replicates of IVF).
(F) Pearson correlation analysis of GF vs. Rag2−/− embryo gene expression on genes filtered for p value <0.05 (purple: significant only in GF-derived embryos; blue: significant only in Rag2−/−-derived embryos; orange: significant in both GF- and Rag2−/−-derived embryos), with DEGs shared between GF and Rag2−/− embryos quantified.
Sequencing experiments were performed once. All other experiments were performed 2 or 3 times. ns, not significant, *p < 0.05, **p < 0.01, and ***p < 0.001 by Student’s t test. Data are shown as mean ± SD.
See also Figures S4 and S5.
