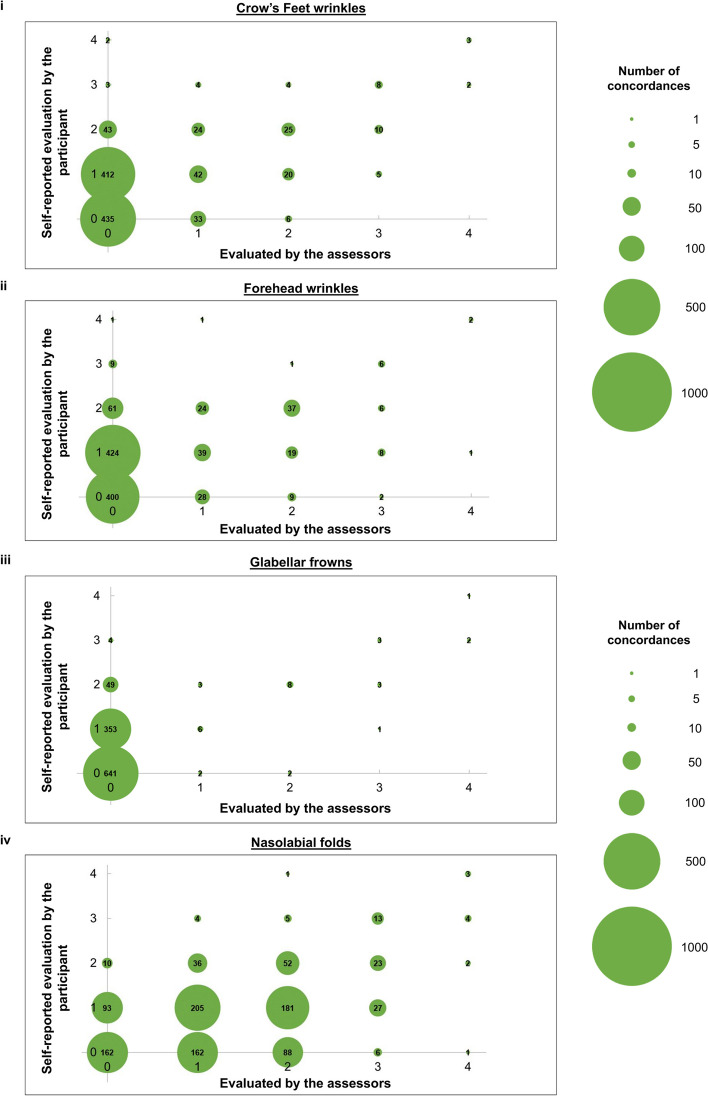
Fig. 1.
i Bubble plots compare the evaluation of Crow’s Feet wrinkles by our three trained assessors and the self-reported evaluation by the participant. For the evaluation performed by our assessors, the phenotype is determined to be present only if all three assessors identify it to be present. Larger circles indicate greater concordance between the two scales. Numbers in the circles are the number of concordances. The sample size of each plot is 1081 participants. ii Bubble plots compare the evaluation of forehead wrinkles by our three trained assessors and the self-reported evaluation by the participant. For the evaluation performed by our assessors, the phenotype is determined to be present only if all three assessors identify it to be present. Larger circles indicate greater concordance between the two scales. Numbers in the circles are the number of concordances. The sample size of each plot is 1081 participants. iii Bubble plots compare the evaluation of glabellar frowns by our three trained assessors and the self-reported evaluation by the participant. For the evaluation performed by our assessors, the phenotype is determined to be present only if all three assessors identify it to be present. Larger circles indicate greater concordance between the two scales. Numbers in the circles are the number of concordances. The sample size of each plot is 1081 participants. iv Bubble plots compare the evaluation of nasolabial folds by our three trained assessors and the self-reported evaluation by the participant. For the evaluation performed by our assessors, the phenotype is determined to be present only if all three assessors identify it to be present. Larger circles indicate greater concordance between the two scales. Numbers in the circles are the number of concordances. The sample size of each plot is 1081 participants

