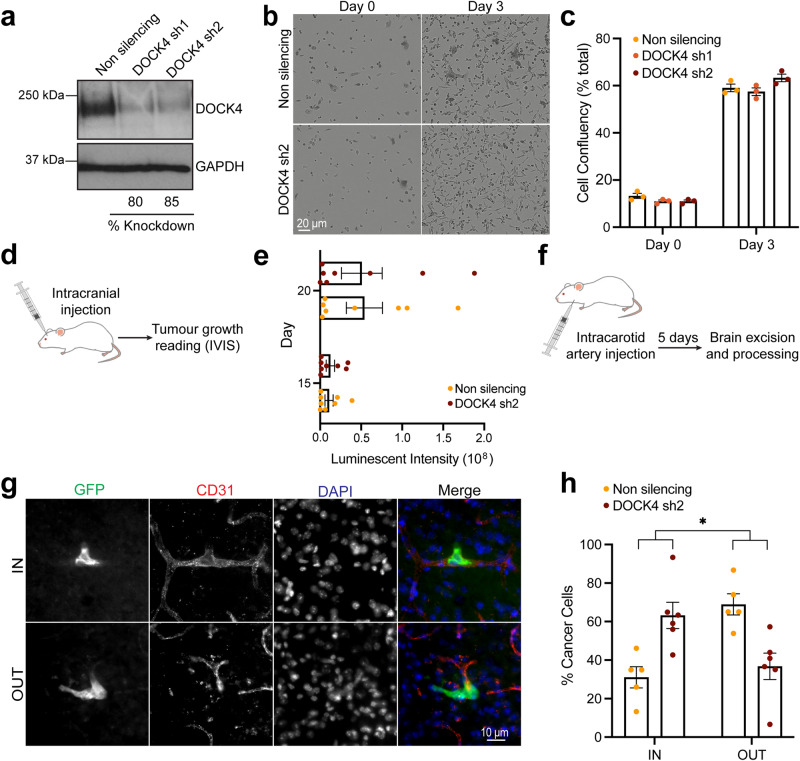
Fig. 1. DOCK4 knockdown inhibits breast cancer cell extravasation to the brain.
a Immunoblot analysis of MDA-MB-231/Brain cells following DOCK4 stable depletion (DOCK4 sh1, DOCK4 sh2). b Still phase images from Supplementary Movie 1 of real-time assessment of MDA-MB-231/Brain cell growth upon stable DOCK4 depletion (DOCK4 sh2). Scale bar = 20 µm. c Graph shows changes in confluency of MDA-MB-231/Brain cells following DOCK4 depletion (DOCK4 sh1, DOCK4 sh2). Error bars represent SEM from 3 biological replicates. d Schematic depicts intracranial implantation of MDA-MB-231/Brain cells stably expressing control (Non silencing) or DOCK4 (sh2) shRNAs followed by monitoring of tumour growth by bioluminescence imaging (IVIS). e Graph shows the increase of bioluminescence signal at days 15 and 20 post-intracranial injection. Error bars represent SEM for N = 10 mice for each condition. f Schematic depicts injection of MDA-MB-231/Brain cells into the carotid artery of mice followed by isolation of brains after 5 days. g Confocal images show MDA-MB-231/Brain cells expressing GFP identified within (IN) or outside (OUT) CD31 positive blood vessels in cryo-sections of excised brains. Scale bar = 10 µm. h Graph shows the percentage of cancer cells located inside (IN) versus outside (OUT) blood vessels 5 days post-intracarotid artery injection of MDA-MB-231/Brain cells. Error bars represent SEM from 2 independent experiments in which 100 cells were scored per mouse brain; N = 6 and N = 5 brains analysed from mice injected with cells stably expressing control (Non silencing), or DOCK4 (sh2) shRNAs respectively. *P < 0.05 by two-tailed Student’s t test.

