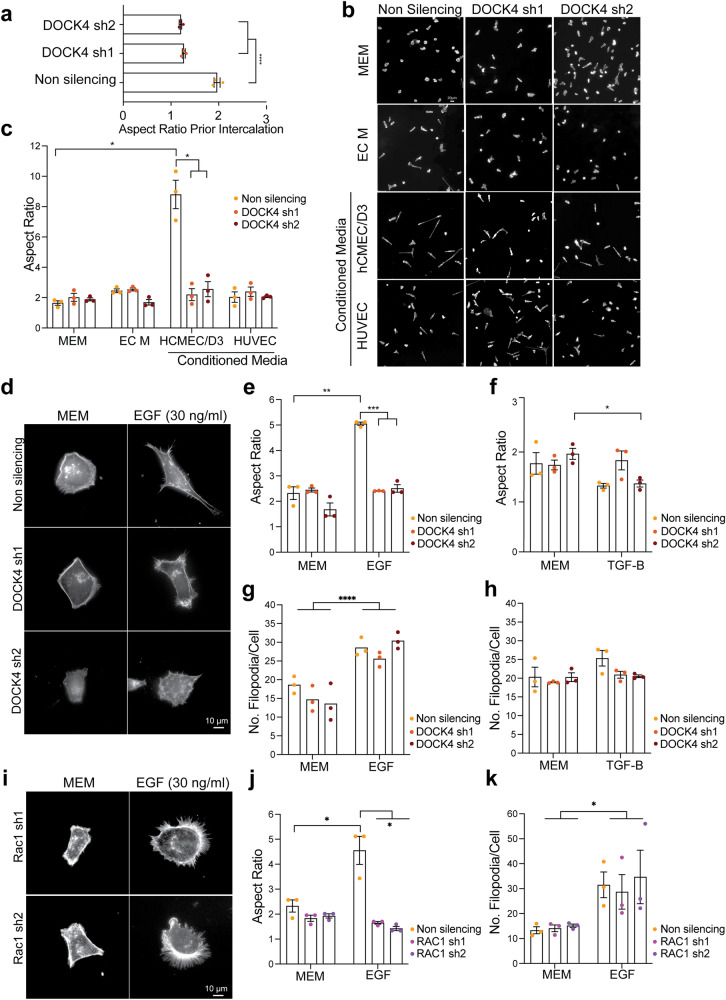
Fig. 3. DOCK4 and RAC1 control breast cancer cell elongation driven by brain endothelial cells and EGF.
a Graph shows elongation (Aspect Ratio, length/width) of MDA-MB-231/Brain control (non silencing), or with DOCK4 depletion (sh1 and sh2) prior to intercalation 4 h post-seeding onto hCMEC/D3. Error bars represent SEM from 2 independent experiments in Fig. 2c in which 240 cells were analysed from ≥6 movies per condition in 3 technical replicates per experiment. ****P < 0.0001 by two-tailed Student’s t test. b Immunofluorescence images of MDA-MB-231/Brain cells upon serum-starvation followed by 4 h stimulation with control Minimal Essential Medium (MEM), Endothelial Cell Medium (EC M), or conditioned media harvested from hCMEC/D3 or HUVEC. c Graph shows the Aspect Ratio of cells shown in b. Error bars represent SEM from N = 3 independent experiments in which 80 cells were analysed per condition. d Immunofluorescence images of MDA-MB-231/Brain cells control (non silencing) or with stable DOCK4 depletion (DOCK4 sh1, DOCK4 sh2) upon serum starvation followed by 4 h stimulation with 30 ng/ml Epidermal Growth Factor (EGF). e, f Graphs show the Aspect Ratio of MDA-MB-231/Brain in d upon 4 h stimulation with MEM, 30 ng/ml EGF (e), or 50 ng/ml Transforming Growth Factor β (TGFβ). Error bars represent SEM from N = 3 independent experiments in which a total of 80 cells were analysed per condition. g, h Graphs show the number of filopodia of MDA-MB-231/Brain cells in d. Error bars represent SEM from N = 3 independent experiments in which 90 cells were analysed per condition. i Immunofluorescence images of MDA-MB-231/Brain stably depleted of RAC1 (sh1 and sh2) upon serum starvation followed by 4 h stimulation with 30 ng/ml EGF. Graphs show the Aspect Ratio (j) and number of filopodia (k) of cells shown in i. Error bars represent SEM from 3 independent experiments in which a total of 81 (j) or 90 (k) cells were analysed per condition. MDA-MB-231/Brain cells in b, d, i were labelled with Alexa Fluor 594 Phalloidin to visualise the actin cytoskeleton. Scale Bars = 10 µm. *P < 0.05; **P < 0.01; ***P < 0.001, ****P < 0.0001 by two-tailed Student’s t test.

