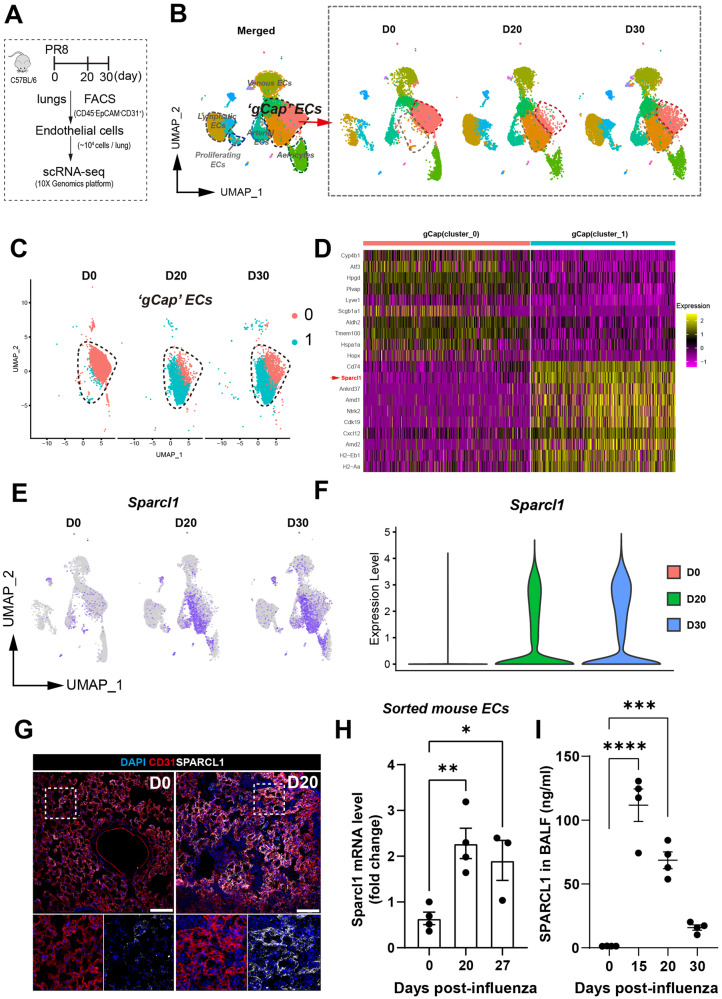
Fig. 1. Single-cell transcriptomics reveals transcriptional dynamics in gCap ECs and increased SPARCL1 expression after viral injury.
A Schematic of mouse lung endothelial single-cell sequencing preparation. B ScRNA-seq analysis for mouse lung ECs sorted from uninjured (D0) and on 20 and 30 days after influenza infection (marked as D20 and D30, respectively). Uniform manifold approximation and projection (UMAP) plots showing the dynamics in gCap ECs. C The 2 gCap EC clusters of interest, cluster_0 (Dev.ECs) and cluster_1 (Immu.ECs), were subsetted from (B). D Heatmap showing the top 20 differentially expressed genes of cluster_0 (Dev.ECs) and cluster_1(Immu.ECs). E UMAP analysis reveals that Sparcl1 is predominantly expressed in gCap ECs, especially in Immu.ECs. F Violin plots showing Sparcl1 expression level in mouse lung ECs sorted from D0, D20 and D30, respectively. G Representative immunostaining of SPARCL1 in endothelial cells (CD31) in both uninjured (D0) and D20 after influenza infection lung tissues. Scale bar, 100 μm. H qPCR analysis of Sparcl1 in isolated lung ECs (CD45−CD31+) sorted on days 0 (uninjured), 20 and 27 after influenza infection, n = 3–4 mice per group (each dot represents one mouse), independent biological replicates. D0 vs. D20: p = 0.006; D0 vs. D27: p = 0.044. I The concentration of SPARCL1 in bronchoalveolar lavage fluid (BALF) was measured by ELISA at 0 (uninjured), 15, 20, and 30 days after influenza infection, n = 4 mice per group, independent biological replicates. D0 vs. D15: p < 0.0001; D0 vs. D20: p = 0.0001. Data in H and I are presented as means ± SEM, calculated using one-way analysis of variance (ANOVA), followed by Dunnett’s multiple comparison test. *P < 0.05, **P < 0.01, ***P < 0.001 and ****P < 0.0001. Source data are provided as a Source Data file.

