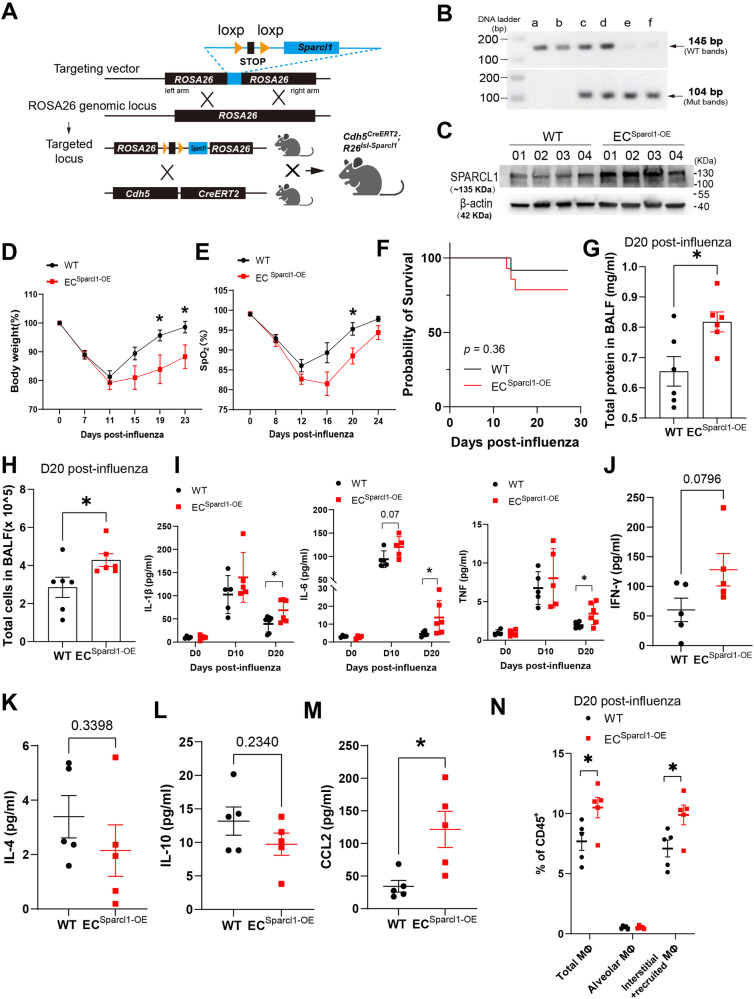
Fig. 3. Endothelial overexpression of Sparcl1 exacerbates influenza-induced pneumonia.
A Schematic of the strategy used to generate Sparcl1 knock-in mice targeting ROSA26 locus. B DNA gel image for genotyping of endothelial Sparcl1 knock-in mice. Lanes a and b represent wild-type mice with PCR product at 145 bp. Lanes c and d represent heterozygous mice with product at 145 bp (wt) and product at 104 bp (mut). Lanes e and f represent homozygous mice with PCR product at 104 bp. C Western blot of SPARCL1 in whole lung tissue from ECSparcl1-OE (VECadCreERT2; Sparcl1+/wt or VECadCreERT2; Sparcl1+/+) or WT (VECadCreERT2) mice 2 weeks after 5 doses of tamoxifen, the image showing representative data from n = 4 biological replicates. D Time course of changes in body weight and E capillary oxygen saturation in WT and ECSparcl1-OE mice after influenza infection. D WT: n = 9 mice, ECSparcl1-OE: n = 7 mice, independent biological replicates; D19: p = 0.02, D23: p = 0.03. E n = 5 mice per group, independent biological replicates; D20: p = 0.03. F Kaplan–Meier survival curves after influenza infection, log-rank test. WT: n = 12 mice, ECSparcl1-OE n = 14 mice. Total protein (G) and cells (H) were quantified in BALF on day 20 post influenza infection, n = 6 mice per group, independent biological replicates. G p = 0.02; H p = 0.046. I The concentration of pro-inflammatory cytokines, IL-1β, IL-6 and TNF in BALF were measured by ELISA in WT and ECSparcl1-OE mice at 0 (uninjured, n = 3 independent biological replicates per group), 10 (n = 5 independent biological replicates per group) and 20 (n = 5 independent biological replicates per group) days post-influenza infection. IL-1β (D20): p = 0.037; IL-6 (D20): p = 0.04; TNF (D20): p = 0.032. ELISA measurement of IFN-γ (J), IL-4 (K), IL-10 (L), and CCL-2 (M) in WT and ECSparcl1-OE mice on day 20 post-infection. n = 5 mice per group, independent biological replicates. CCL-2: p = 0.017. N. Quantification of the proportion of total macrophages (CD64+F4/80+), alveolar macrophages (CD45+Ly6G-CD64+F4/80+SiglecF+) and interstitial and recruited macrophages (CD45+Ly6G-CD64+F4/80+SiglecF-) in CD45+ live cells at day 20 after influenza infection in WT and ECSparcl1-OE mice, n = 5 mice per group, independent biological replicates. Gated as shown in Supplementary Fig. 11A. Total macrophages: p = 0.037; interstitial and recruited macrophages: p = 0.032. Data in D, E and G to H and J to N are presented as means ± SEM, calculated using an unpaired two-tailed t-test. Data in I is presented as means ± SD, calculated using an unpaired two-tailed t-test. *P < 0.05. Data in F were calculated using log-rank test. *P < 0.05, ns: not significant, P > 0.05. Source data are provided as a Source Data file.

