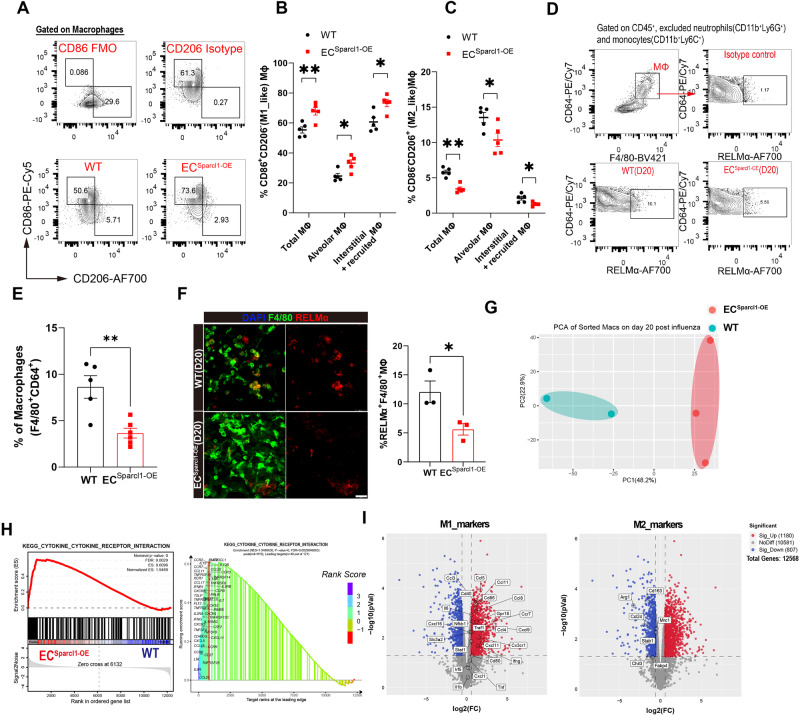
Fig. 4. Endothelial overexpression of Sparcl1 promotes M1-like polarization of lung macrophages.
A Representative gating scheme for identification of pulmonary M1-like (CD86+CD206−) and M2-like (CD86−CD206+) macrophages (CD45+Ly6G−CD64+F4/80+) at day 20 after influenza infection in WT and ECSparcl1-OE mice. Macrophage gating strategies as shown in Supplementary Fig. 11A. Quantification of the proportion of B M1-like (CD86+CD206−) and C M2-like (CD86−CD206+) macrophages in total lung macrophages (CD45+Ly6G−CD64+F4/80+), alveolar macrophages (CD45+Ly6G−CD64+F4/80+SiglecF+) and interstitial and recruited macrophages (CD45+Ly6G−CD64+F4/80+SiglecF−) at day 20 after influenza infection in WT and ECSparcl1-OE mice, n = 5 mice per group, independent biological replicates. WT vs. ECSparcl1-OE mice: B p = 0.005(Total MΦ), p = 0.015(Alveolar MΦ), p = 0.01(Interstitial+ recruited MΦ); C p = 0.002(Total MΦ), p = 0.026(Alveolar MΦ), p = 0.019(Interstitial+ recruited MΦ). D Gating strategy for M2-like macrophage (RELMα+) in WT and ECSparcl1-OE mice on day 20 post influenza infection. E Quantification of M2-like macrophage (RELMα+/CD64+F4/80+) by flow cytometry analysis in WT (n = 5 independent biological replicates) and ECSparcl1-OE (n = 6 independent biological replicates) mice, p = 0.0031. F Left: representative immunostaining of lung M2_like macrophage (RELMα+F4/80+) in WT and ECSparcl1-OE mice on day 20 post influenza infection, scale bars, 25 μm. Right: quantification of the proportion of M2_like macrophages (RELMα+F4/80+/F4/80+) in left, n = 3 mice per group, independent biological replicates, p = 0.038. G Principal components analysis (PCA) indicates transcriptomic changes in lung macrophages between WT (n = 2 independent biological replicates) and ECSparcl1-OE mice (n = 3 independent biological replicates) on day 20 post-influenza infection. H Gene set enrichment analysis (GSEA) of RNA-seq profiles of purified lung macrophages isolated from WT and ECSparcl1-OE mice on day 20 post influenza infection. Enrichment score and p value are displayed. I Volcano plot indicating the M1-associated genes upregulated in lung macrophage from ECSparcl1-OE mice and M2-associated genes down-regulated on day 20 post influenza infection. Data in B, C, and E are presented as means ± SEM, and data in F is presented as means ± SD, calculated using an unpaired two-tailed t-test. *P < 0.05, **P < 0.01. Source data are provided as a Source Data file.

